Is Advanced Micro Devices (AMD) stock about to soar on the back of the semiconductor boom? [Video]
![Is Advanced Micro Devices (AMD) stock about to soar on the back of the semiconductor boom? [Video]](https://editorial.fxstreet.com/images/Markets/Equities/display-panel-of-daily-stock-market-59908972.jpg)
Advanced Micro Devices, Inc (AMD) is a US multinational semiconductor company that offers high-performance computing platforms for cloud, edge, and end devices. Its products include CPUs, GPUs, FPGAs, and Adaptive SoCs, which are used in various devices, including personal computers, gaming consoles, and servers. AMD faced challenges in the past but regained some of its market share thanks to the success of its Ryzen processors. The company has expanded into new markets and plans to enter the high-performance computing market. AMD is listed on NASDAQ and is a component of NASDAQ 100 and S&P 500 Information Technology.
Pivot Wyckoff change of character to bullish trend
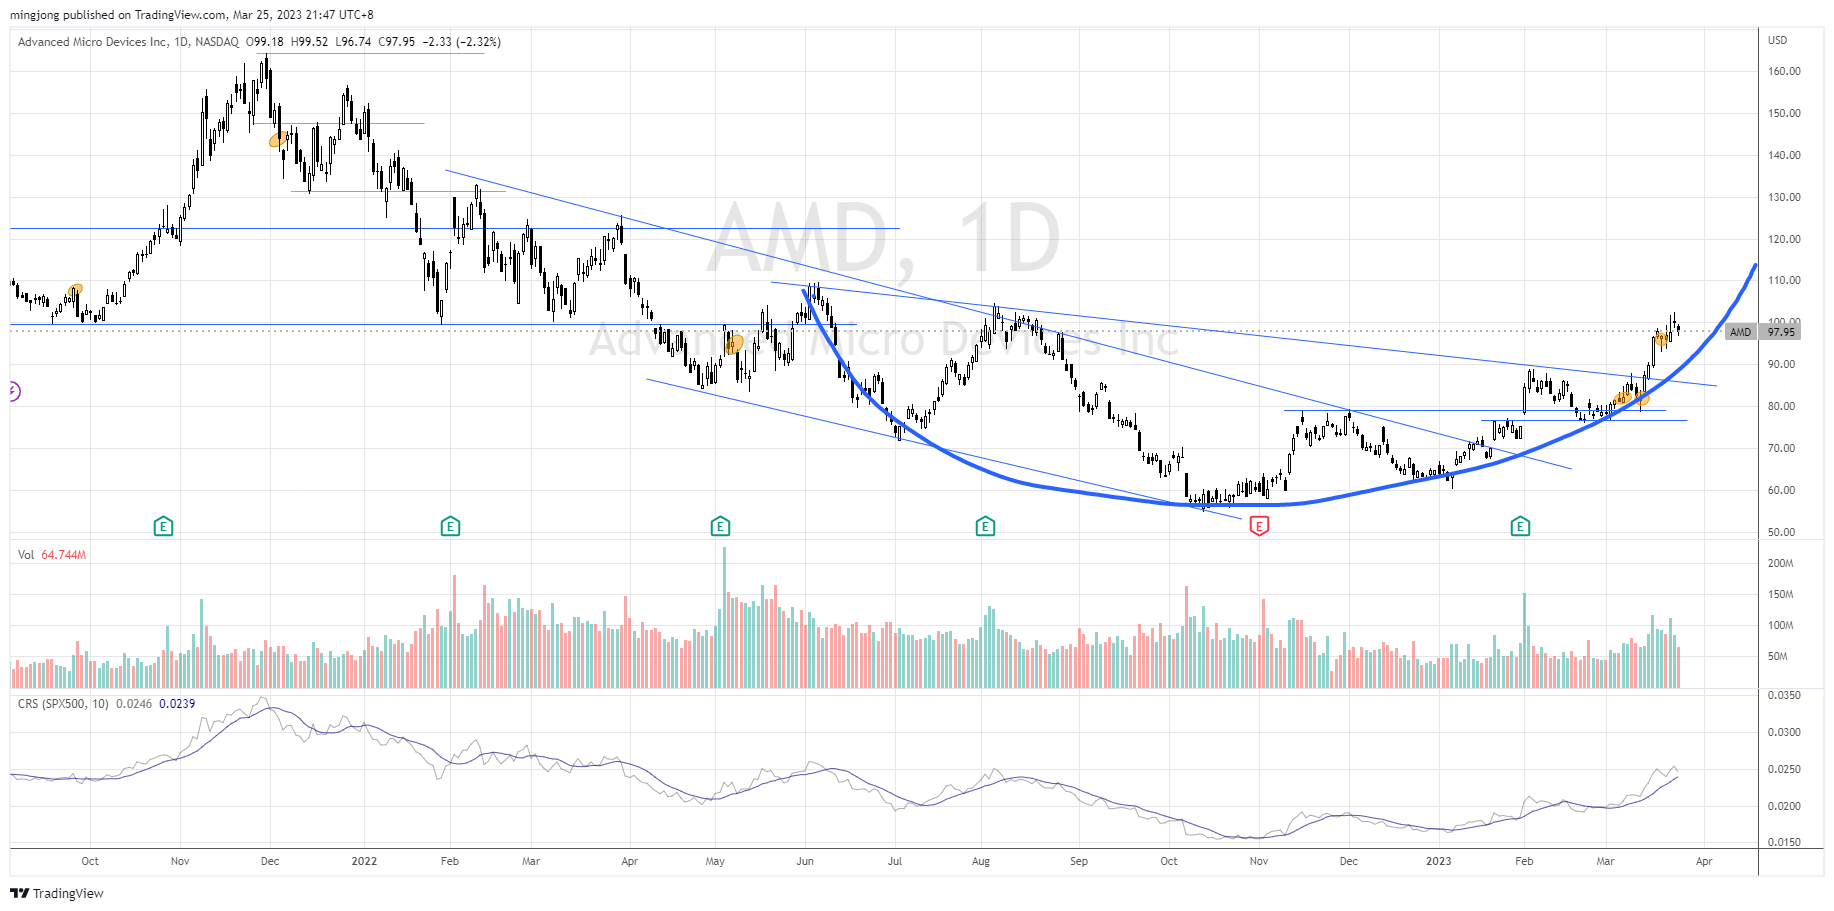
In late Nov 2021, AMD reached an all-time high of $164.46 but retraced subsequently from that point. The price was unable to rebound and instead entered a Wyckoff distribution phase. It broke the $122.50 axis and retested the support of $100 on 22 Jan 2022. The following weeks saw the price range bound and the increase in volume with inability to rally up suggests more weakness ahead. This was confirmed when the price broke the $100 support in a Wyckoff last point of supply (LPSY) fashion.
There was a spike in volume on 4 May, but no follow through to the up side which led to a redistribution. The Wyckoff sign of weakness (SOW) took the price down to around $54.60 on 13 Oct. The volume was high but no further down move suggested it was stopping volume. The test of the selling climax in Dec 2022 contained lower volume with a higher low followed by a higher high rally that broke out from the downtrend line. This signaled an important concept, a Wyckoff change of character, which switched the bias from downtrend into at least a trading range if not a reversal.
The year 2023 began with a formidable SOS rally where AMD broke above the $79 resistance with earning results as catalyst on 1 Feb. There was a spike in volume but the shallow pullback tested the resistance-turned-support at $76-$79 with low volume hinted at supply absorption. It is now testing the long term resistance of $100.
Bias
Bullish. According to the Wyckoff method, AMD has just broken out from the short-term Wyckoff accumulation phase and back up (BU). It is now in phase E to challenge the $100 axis, which could form a larger accumulation structure. The last 3 days are showing rejection tails with localized increase in volume. Nevertheless, the bullish price structure is still intact and will likely see more rally up to test immediate targets of $110 and $122.50 subsequently as supported by the rounding bottom pattern tweeted below.
$AMD bullish rounding bottom. Short-term overextended. Sign of strength rally (SOS) pending a backup action. Another strong #semiconductor stock pic.twitter.com/kkeKDU140Y
— Ming Jong Tey (@MingJong) March 25, 2023
If the price breaks below $89, it will likely retest the support zone between $79 and $76.60.
AMD was discussed in detail in my weekly live group coaching on 7 Mar 2023 before the market opened. Despite the failure scenario showed up as discussed in this latest video (refer below), the characteristics of the FOMC bar was not as bearish as anticipated. This could present a trading opportunity for AMD to ride on its strong bullish momentum.
Author

Ming Jong Tey
Independent Analyst
Ming Jong Tey has been trading since 2008. He started his learning journey from technical analysis (indicators, Fibonacci, etc...) to value investing. Throughout his journey, he develops an interest in price action with chart pattern trading.


