Is 5,000 just a temporary pause for the S&P 500?
On Friday, stock prices took a downward turn following the release of the Producer Price Index (PPI), which came out higher than expected at +0.3% month-over-month. The S&P 500 index lost 0.48%, pulling back from its record high of 5,048.39 reached on February 12. Last week, the market was rebounding from Tuesday’s local low of 4,920.31, and it was on its way to re-test the all-time high; however, Friday’s data halted that rally.
Recently, the stock market continued to rally, fueled by advances in a handful of tech sector stocks, but as I wrote on February 7, “We may have to deal with a correction or consolidation of several weeks of advances. With the season of quarterly earnings announcements coming to an end and a series of important economic data, profit taking may follow.”
This morning, futures contracts are indicating a 0.4% lower opening for the trading session, further extending Friday’s downward correction of the S&P 500 index. The market may see some more uncertainty and a consolidation along the 5,000 level. Investors are now eagerly awaiting tomorrow’s quarterly earnings release from NVDA, preceded by the FOMC Meeting Minutes announcement.
Last week, investor sentiment has worsened a bit; Wednesday’s AAII Investor Sentiment Survey showed that 42.2% of individual investors are bullish, while 26.8% of them are bearish. The AAII sentiment is a contrary indicator in the sense that highly bullish readings may suggest excessive complacency and a lack of fear in the market. Conversely, bearish readings are favorable for market upturns.
Last Tuesday, I mentioned, "The market may return to a month-long upward trend line, currently around 4,950", and indeed, the S&P 500 did just that, briefly dipping below that line. The previous highs and lows from January acted as support levels around 4,900, and on Thursday, the index came back above 5,000, as we can see on the daily chart.
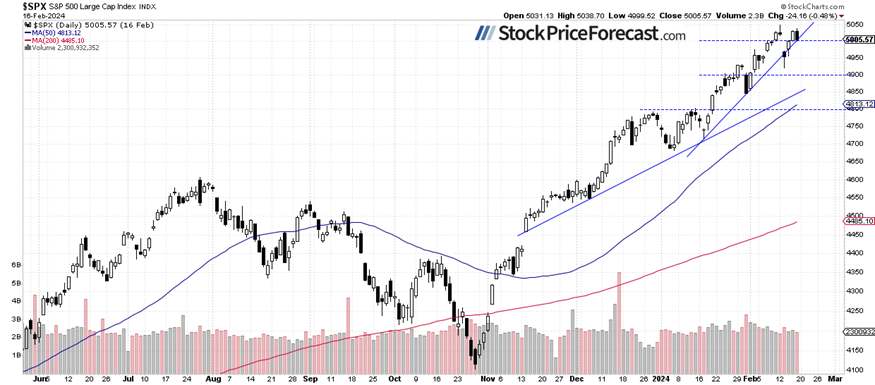
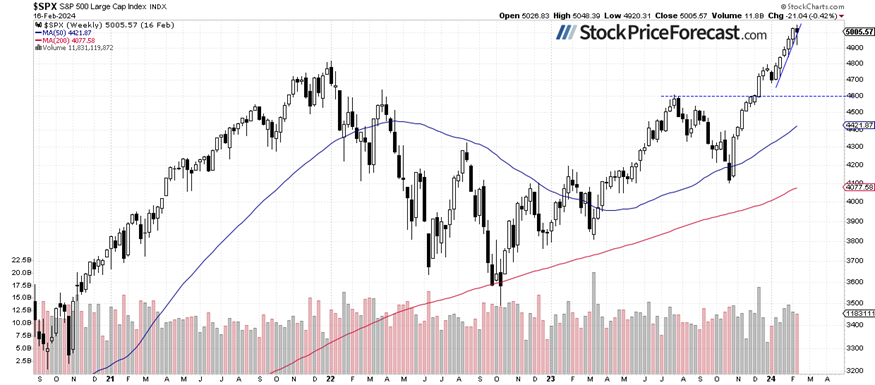
S&P 500 - First weekly decline since early January
The weekly chart of the S&P 500 reveals an over month-long rally, starting from early January. The market has been accelerating its medium-term uptrend since a relatively flat correction in December. Last week on Monday, I noted that “there are indications that another correction or consolidation may be in the cards.” Indeed, the market retraced some of the rally, and despite the subsequent rebound, it ended the week lower overall.
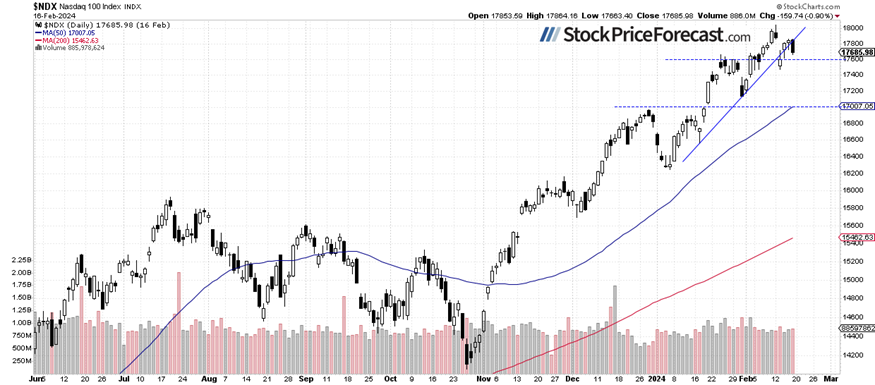
Nasdaq 100 remains relatively weaker
Last Monday, the technology-focused Nasdaq 100 index reached a new all-time high at 18,041.45, but by Tuesday, it sold off below the 17,500 level. In the subsequent days, it began retracing the decline, but on Friday, the tech stocks' gauge lost 0.9%, surpassing the decline of the S&P 500.
Recently, it has been relatively weaker than the broader stock market, but last week, it caught up with the S&P 500 index. However, Nasdaq’s rally was led by a handful of “FANG” stocks like META, NVDA and MSFT. On the previous Wednesday, I wrote about the NYSE FANG+ index.
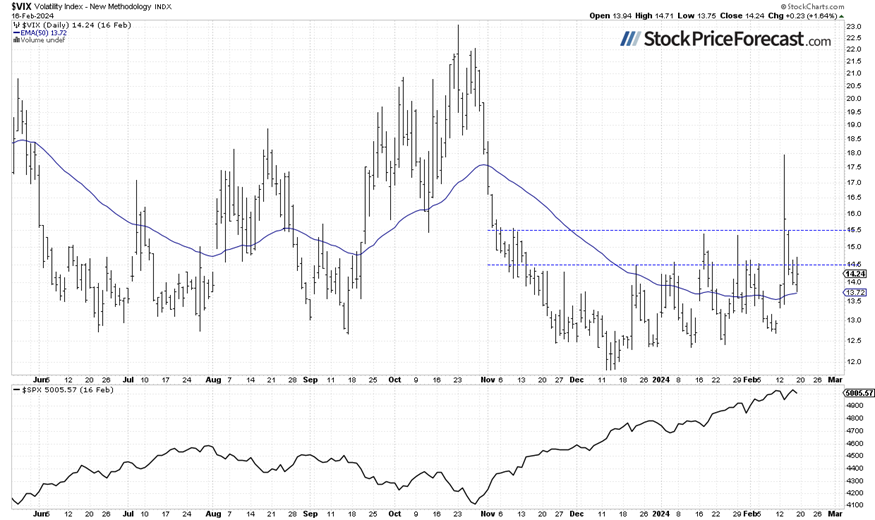
VIX – Extending consolidation
The VIX index, also known as the fear gauge, is derived from option prices. Last Tuesday, it broke above the previous local highs of around 15.00-15.50, peaking at 18. However, starting from Wednesday, it began retracing towards the 14 level as stocks bounced back from their Tuesday low.
Historically, a dropping VIX indicates less fear in the market, and rising VIX accompanies stock market downturns. However, the lower the VIX, the higher the probability of the market’s downward reversal.
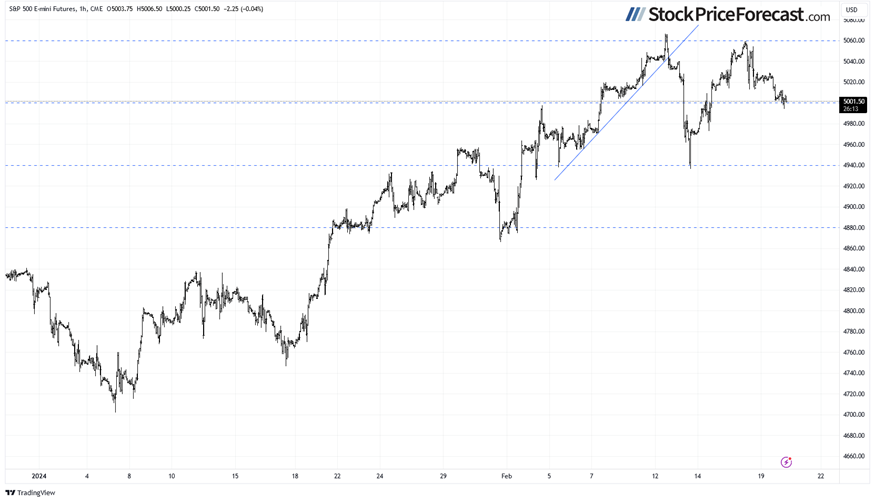
Futures contract is at 5,000 again
Let’s take a look at the hourly chart of the S&P 500 futures contract. Last week, the market rebounded from Tuesday's local low of around 4,940, reached after the CPI release. However, this bounce was short-lived, as Friday's PPI release caused the market to retreat from its local high of around 5,060. The resistance level remains at around 5,040-5,060, and more uncertainty and a consolidation is expected.
Conclusion
The recent trading action was very bullish, with some of the tech stocks rallying to new record highs, the S&P 500 index breaking above 5,000, and the Nasdaq 100 index getting close to 18,000. In my last Tuesday's analysis, I noted that, “in the short term, the possibility of a downward correction cannot be overlooked. A quick glance at the chart reveals that the S&P 500 index has recently become more volatile.”. Indeed, the correction occurred pretty fast, with the inflation number contributing to the downturn. However, the market quickly retraced the decline in the following days. Friday’s session showed that not everything points to new record highs, and the market may experience some more uncertainty and consolidation.
This morning, the S&P is likely to open 0.4% lower. The index will likely fluctuate around support and resistance levels as investors seek to capitalize on profits following the rally from last year's late October low.
For now, my short-term outlook remains neutral.
Here’s the breakdown:
-
The S&P 500 is likely to retrace more of its last week’s advances from Tuesday’s local low.
-
A longer consolidation phase may ensue, following an extended rally over the past months.
-
In my opinion, the short-term outlook is neutral.
The full version of today’s analysis - today’s Stock Trading Alert - is bigger than what you read above, and it includes the additional analysis of the Apple (AAPL) stock and the current S&P 500 futures contract position. I encourage you to subscribe and read the details today. Stocks Trading Alerts are also a part of our Diamond Package that includes Gold Trading Alerts and Oil Trading Alerts.
And if you’re not yet on our free mailing list, I strongly encourage you to join it - you’ll stay up-to-date with our free analyses that will still put you ahead of 99% of investors that don’t have access to this information. Join our free stock newsletter today.
Want free follow-ups to the above article and details not available to 99%+ investors? Sign up to our free newsletter today!
Want free follow-ups to the above article and details not available to 99%+ investors? Sign up to our free newsletter today!
Author

Paul Rejczak
Sunshine Profits
Paul Rejczak is a stock market strategist who has been known for the quality of his technical and fundamental analysis since the late nineties.


