Interactive broker (IBKR)’s unstoppable rally: 2-year causes that will take it even higher [Video]
![Interactive broker (IBKR)’s unstoppable rally: 2-year causes that will take it even higher [Video]](https://editorial.fxstreet.com/images/Markets/Equities/Industries/Pharma/paracetamol-capsules-637435383109464449.jpg)
Interactive Brokers Group Inc. (IBKR) is a global electronic market maker and broker that processes trades across more than 135 electronic exchanges and market centers worldwide. It provides customers with low prices and tools for trading, risk and portfolio management, and research facilities. The firm is focusing on its Electronic Brokerage segment and has been winding down its Market Making segment. Interactive Brokers LLC operates the largest electronic trading platform in the US by number of daily average revenue trades, and brokers a range of securities and cryptocurrencies. The firm is regulated by several authorities and provides clearing services to 200 introducing brokers worldwide.
Wyckoff accumulation leading to sign of strength rally
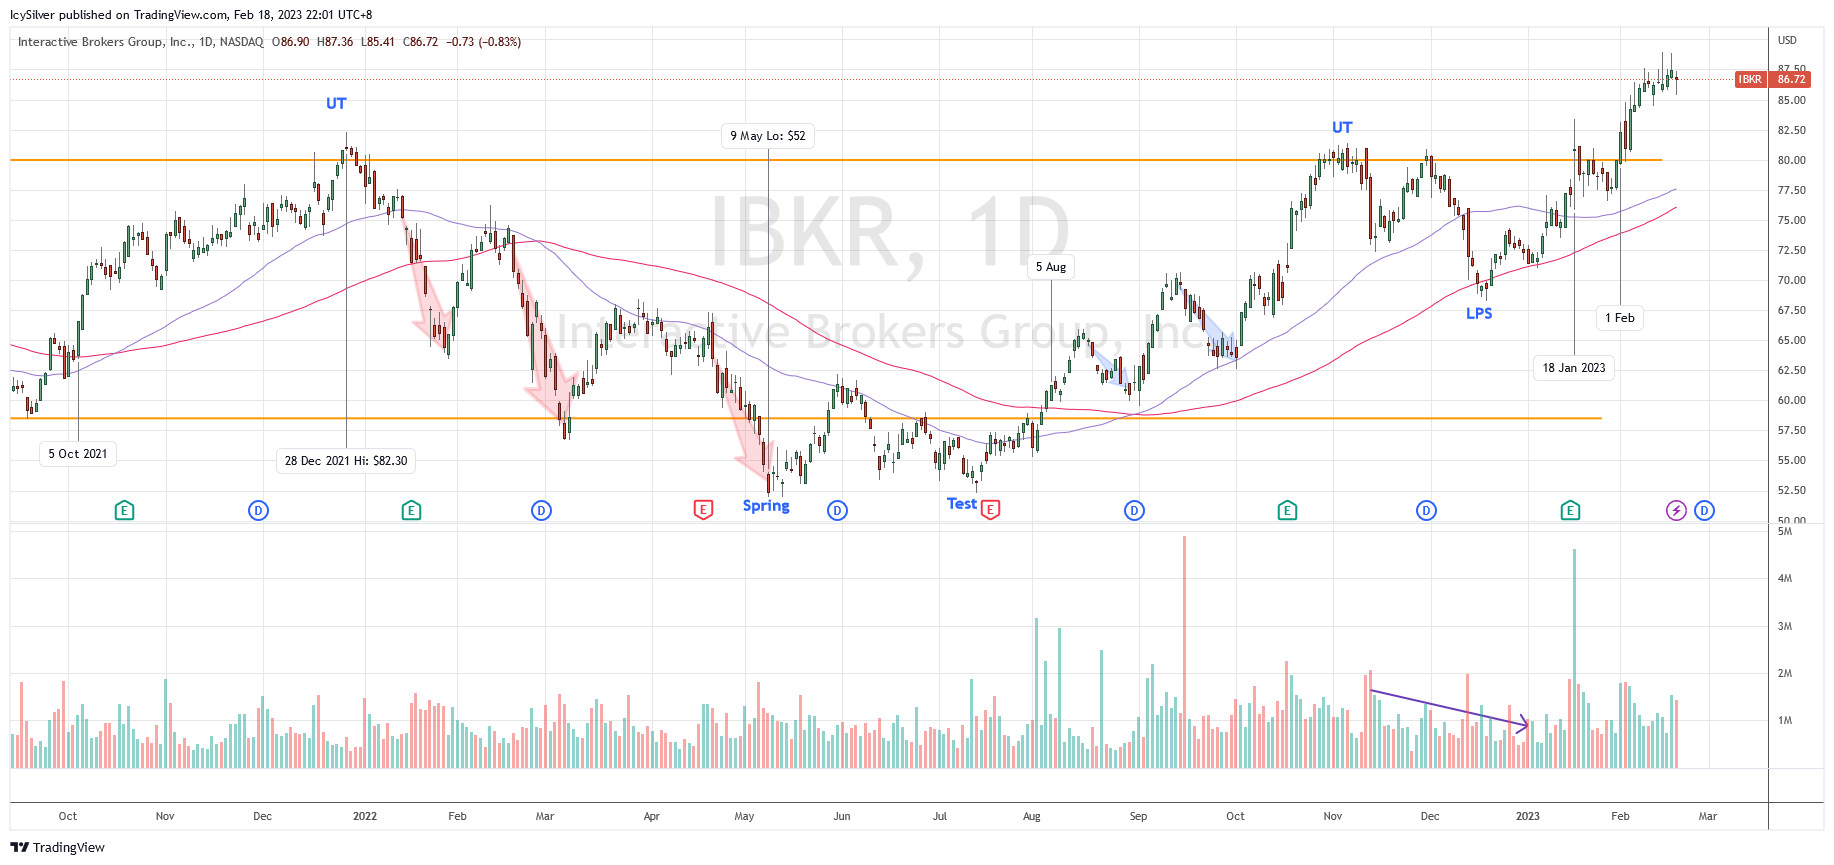
IBKR has been moving in a trading range between $58.50 and $80 since Feb 2021. On 5 Oct 2021, the price began a Wyckoff sign of strength (SOS) rally to challenge the $80 resistance and hit $82.30 on 28 Dec 2021. However, the price did not follow through with bullish momentum and retraced back into the range to form a Wyckoff upthrust (UT). The Wyckoff sign of weakness (SOW) leg down was rapid and impulsive. The inability to rally up in March 2022 led to further weakness.
The price broke the key level at $58.5 and finally found support around $52 on 9 May in a Wyckoff spring manner. Subsequently, the price rallied but also retested the low until it itched back into the range. For the next several months, there were several short SOS rally with brief pull back forming higher lows. The pull backs during this period were less impulsive than Jan to May, suggesting a Wyckoff change of character (CHoC).
Around November, there were two more Wyckoff UT before tracing to the middle of the trading range. Exhaustion of supply is also observed with volume decreasing. The price broke $80 again on 18 Jan 2023 with a spike of volume. However, the pull back this time was shallow and was able to commit above $80 on 1 Feb. The rally continued to break all time high and is currently experiencing some rejection at $88 with shortening of the thrust (SOT) to the upside, suggesting exhaustion of the up momentum..
Bias
Bullish. According to the Wyckoff method, IBKR has completed a 2 year Wyckoff accumulation and successfully broke out of the trading range to hit an all time high. It would be reasonable to expect the price to pull back to around $80 to form Wyckoff backup (BU) before further rally.
If the price breaks below $80, it is likely to retest the recent support of $70 to $74.
IBKR was discussed in detail in my weekly live group coaching on 7 Feb 2023 before the market opened. The improving market breadth together with many bullish trade entry setups could suggest a new bull run as discussed in the video below.
Author

Ming Jong Tey
Independent Analyst
Ming Jong Tey has been trading since 2008. He started his learning journey from technical analysis (indicators, Fibonacci, etc...) to value investing. Throughout his journey, he develops an interest in price action with chart pattern trading.


