Intel stock slumps 12% on lowered forward guidance
- Intel stock slumps on Q1 guidance due to supply constraints.
- INTC stock sinks 12% to $47.50 in Friday's premarket.
- Q4 earnings beat consensus by $0.07 to reach $0.15.
- Q1 guidance puts EPS at break-even and revenue down $360 million from Wall Street consensus.

Intel (INTC) stock is sliding on Friday after issuing Q1 guidance that harshly underperforms Wall Street consensus. The legacy chipmaker said that it expects to narrowly break even on earnings per share (EPS) and take in revenue that arrives $360 million below the latest Wall Street consensus.
This initiated an outright sell-off in the stock, which is down 12% in the premarket on Friday.
The wider equity market is also drifting lower, with Dow Jones Industrial Average futures off 0.4% and NASDAQ 100 futures down 0.2% before the open.
Intel beats Q4 expectations but suffers on Q1 guidance
Unfortunately for Intel, which has rallied nearly 150% in the past year after the Trump administration took a stake in the chipmaker, the Q1 guidance overshadowed the results of an impressive turn-around fourth quarter. Adjusted EPS in Q4 arrived at $0.15, $0.07 better than consensus. Revenue of $13.7 billion also bested projections by over $300 million.
But executives said that supply constraints would hinder the company's achievement of continued success in Q1 2026. Intel provided a wide range for Q1 sales, spanning from $11.7 billion to $12.7 billion. But Wall Street immediately noticed the $12.2 midpoint was about $360 million below their consensus.
Likewise, Intel says it hopes to break even on EPS in Q1, whereas consensus had been a $0.05 profit.
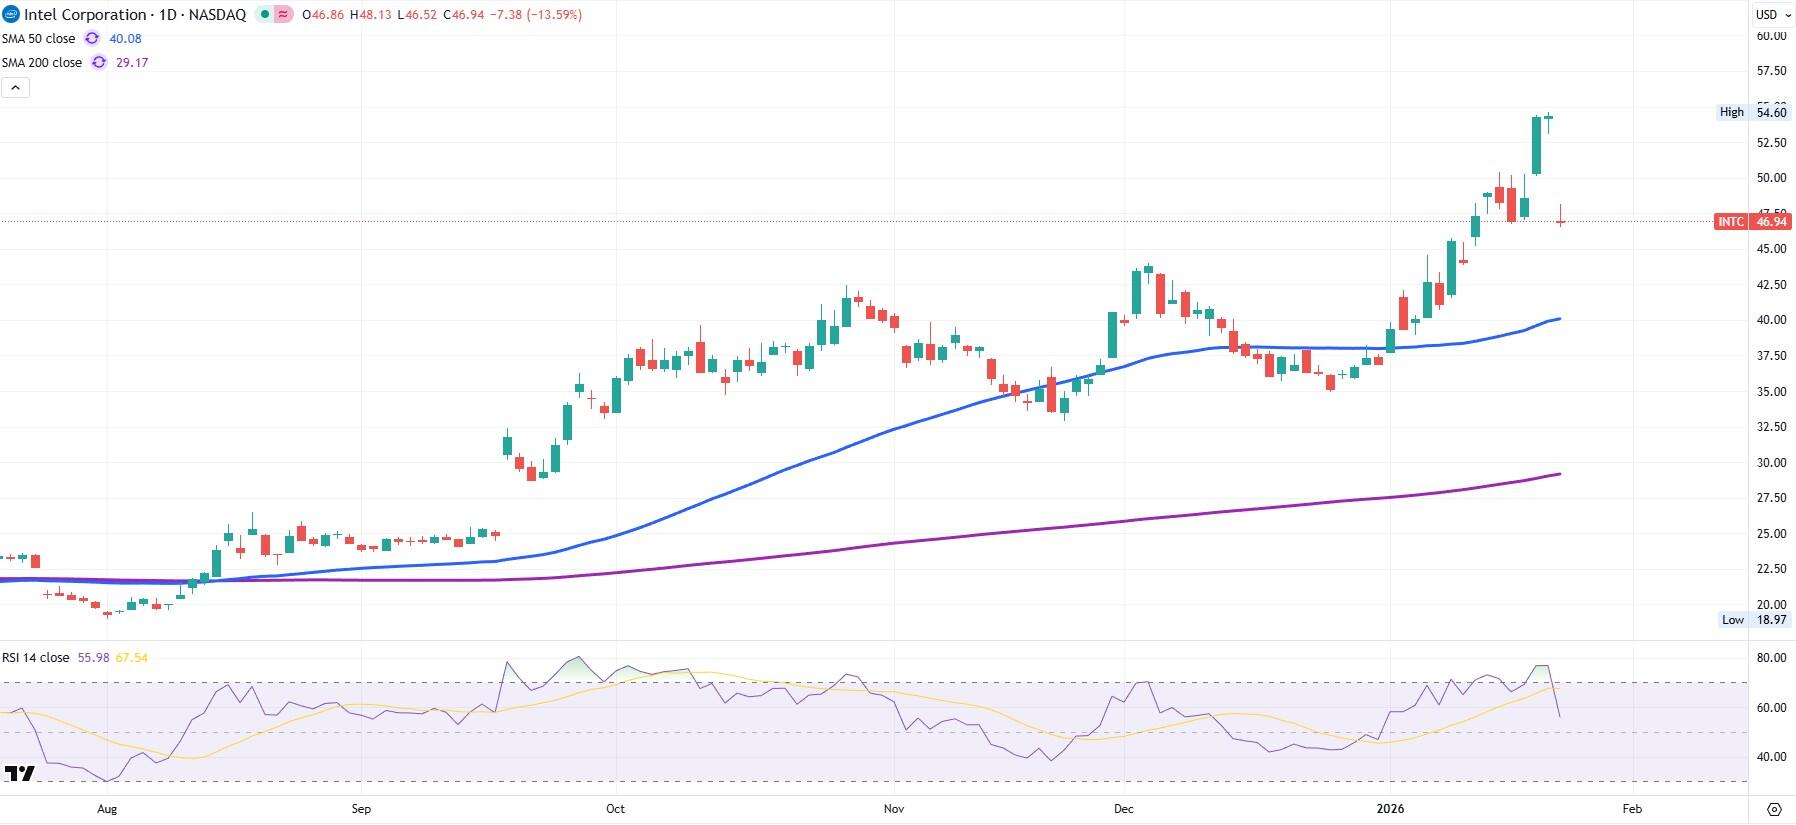
The news sent INTC shares spiraling from $54.32 to $47.50 in the premarket.
Of 19 sell-side firms with price targets on Intel stock, the average price target is $46.89. The high comes from KeyBanc at $65 and Rosenblatt at $30. KeyBanc noted that supply constraints to the company's CPU product suite would dent Q1 results but raised its price target from $60 to $65 on its prediction that Intel would eventually win contracts from Apple (AAPL) for its 18A and 14A product lines.
Intel stock chart
While Intel stock has been on a red-hot tear since last September, Friday's performance gives us a blow-off top. Resistance is now firmly etched at $54.60, while interested buyers will hope that the prior resistance from December 3, 2025 near $44 will hold the line. The 50-day Simple Moving Average (SMA) is a bit further down near $40.
However, if buying is strong at either of those levels, then the uptrend remains intact. Since most analysts remain bullish on Intel's 2026 prospects (in the period after Q1 of course), expect bulls to continue accumulating at these near-term lower levels before making a second run for the region above $54.
Author

Clay Webster
FXStreet
Clay Webster grew up in the US outside Buffalo, New York and Lancaster, Pennsylvania. He began investing after college following the 2008 financial crisis.


