Infineon Technologies AG is a German semiconductor manufacturing corporation. It has been founded 1999 as a spin-off from Siemens AG and the headquarteres of the company are in Neubiberg, Germany. Today, Infineon belongs to the DAX index and one can trade it under the ticker $IFX at Frankfurt Stock Exchange. The company is the world leader in automotive and power semiconductors. Worldwide, Infineon counts more than 45’000 employees.
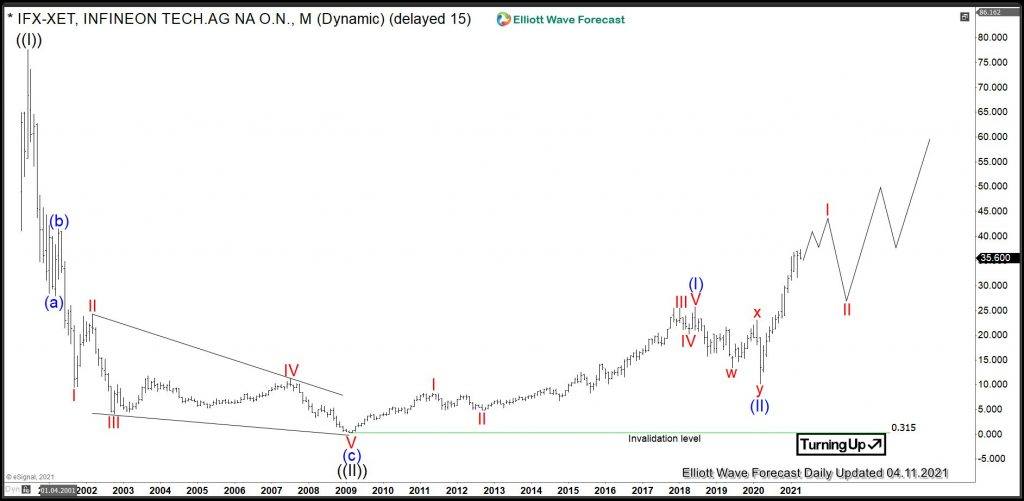
Infineon Monthly Elliott wave analysis 04.16.2021
The monthly chart below shows the Infineon shares $IFX traded at Frankfurt Stock Exchange. From the all-time lows, the stock price has developed a cycle higher in wave ((I)) towards the 77.57 highs. There, in June 2000, it has printed the all-time highs. After the primary impulse higher, a correction lower in wave ((II)) has ended on March 2009 at 0.31.
From the March 2009 lows, a new cycle in wave ((III)) has started and develops a series of nests. First of all, a cycle higher as a blue wave (I) has ended in June 2018 at 25.76. Hereby, within the impulsive advance, all the subways I, III and V are impulsive waves, too. Wave III demonstrates a clear extension in price. From the June 2018 highs, a correction in wave (II) lower has unfolded as a double three pattern. It has printed the low in March 2020 at 10.13.
From the March 2020 lows, a new cycle in wave (III) of ((III)) has already started. As a matter of fact, the break of 25.76 has confirmed that. As of right now, the price is within red wave I of blue wave (III). Once finished, pullback in wave II should find support in 3, 7, 11 swings above 10.13 lows for another extension higher in wave III. Therefore, investors and traders can be looking to buy Infineon targeting the 77.97-125.94 area in a longer view.
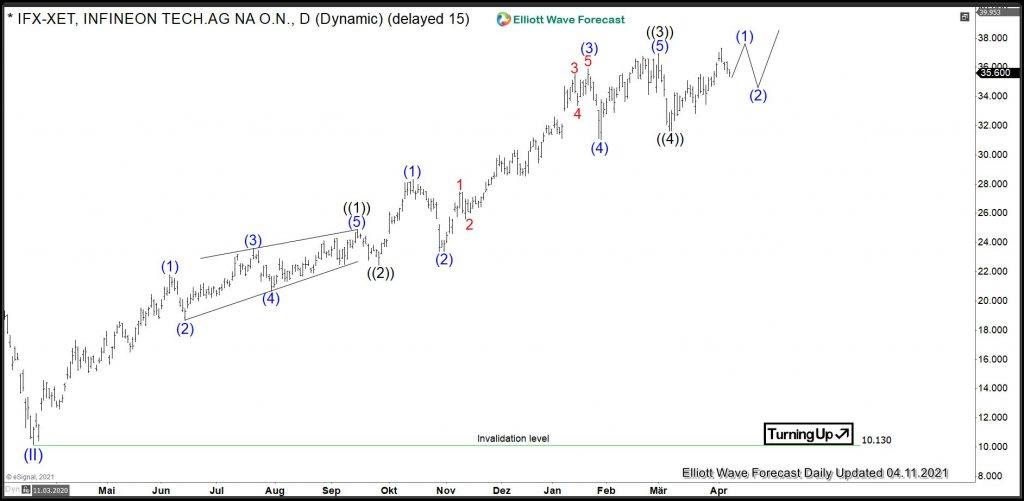
Infineon daily Elliott wave analysis 04.16.2021
The Daily chart below shows the $IFX shares price action in more detail. From the March 2020 lows at 10.13, the stock price has advanced in black waves ((1)) – ((3)) of the red wave I. The correction lower in wave ((4)) has ended at 31.61. While above there, the Infineon stock is within black wave ((5)) of red wave I. Once the march 2020 cycle in wave I has finished, expect a pullback in wave II to find support in 3, 7 or 11 swings above 10.13 lows for an expected acceleration in wave III of (III).
FURTHER DISCLOSURES AND DISCLAIMER CONCERNING RISK, RESPONSIBILITY AND LIABILITY Trading in the Foreign Exchange market is a challenging opportunity where above average returns are available for educated and experienced investors who are willing to take above average risk. However, before deciding to participate in Foreign Exchange (FX) trading, you should carefully consider your investment objectives, level of xperience and risk appetite. Do not invest or trade capital you cannot afford to lose. EME PROCESSING AND CONSULTING, LLC, THEIR REPRESENTATIVES, AND ANYONE WORKING FOR OR WITHIN WWW.ELLIOTTWAVE- FORECAST.COM is not responsible for any loss from any form of distributed advice, signal, analysis, or content. Again, we fully DISCLOSE to the Subscriber base that the Service as a whole, the individual Parties, Representatives, or owners shall not be liable to any and all Subscribers for any losses or damages as a result of any action taken by the Subscriber from any trade idea or signal posted on the website(s) distributed through any form of social-media, email, the website, and/or any other electronic, written, verbal, or future form of communication . All analysis, trading signals, trading recommendations, all charts, communicated interpretations of the wave counts, and all content from any media form produced by www.Elliottwave-forecast.com and/or the Representatives are solely the opinions and best efforts of the respective author(s). In general Forex instruments are highly leveraged, and traders can lose some or all of their initial margin funds. All content provided by www.Elliottwave-forecast.com is expressed in good faith and is intended to help Subscribers succeed in the marketplace, but it is never guaranteed. There is no “holy grail” to trading or forecasting the market and we are wrong sometimes like everyone else. Please understand and accept the risk involved when making any trading and/or investment decision. UNDERSTAND that all the content we provide is protected through copyright of EME PROCESSING AND CONSULTING, LLC. It is illegal to disseminate in any form of communication any part or all of our proprietary information without specific authorization. UNDERSTAND that you also agree to not allow persons that are not PAID SUBSCRIBERS to view any of the content not released publicly. IF YOU ARE FOUND TO BE IN VIOLATION OF THESE RESTRICTIONS you or your firm (as the Subscriber) will be charged fully with no discount for one year subscription to our Premium Plus Plan at $1,799.88 for EACH person or firm who received any of our content illegally through the respected intermediary’s (Subscriber in violation of terms) channel(s) of communication.
Recommended content
Editors’ Picks
EUR/USD trades weak below 1.0800 amid Good Friday lull, ahead of US PCE
EUR/USD remains depressed below 1.0800, as traders lack directional impetus amid minimal volatility and thin liquidity on Good Friday. The pair keenly awaits the US PCE inflation data and Fed Chair Powell's speech for fresh hints on next week's price action.
GBP/USD holds steady above 1.2600 as markets stay calm on Good Friday
GBP/USD trades sideways above 1.2600 amid a typical Good Friday trading lull. A broadly firmer US Dollar could keep any upside attempts limited in the pair ahead of the US PCE inflation data and Fed Chair Powell's appearance.
Gold ends Q1 2024 at record highs, what’s next?
Gold is sitting at an all-time high of $2,236, lacking a trading impetus amid holiday-thinned conditions on Good Friday. Most major world markets, including the United States are closed in observance of Holy Friday, leaving volatility around Gold price highly subdued.
Ripple's move above this key level could trigger nearly 50% rally for XRP
Ripple price has overcome a critical resistance level and flipped into a support floor on the weekly time frame. This development happened while XRP tightly consolidated for roughly 250 days.
US core PCE inflation set to ease in February on month as Federal Reserve rate cut bets for June mount
The core Personal Consumption Expenditures Price Index is set to rise 0.3% MoM and 2.8% YoY in February. The revised Summary of Projections showed that policymakers upwardly revised end-2024 core PCE forecast to 2.6% from 2.4%.