Indian Rupee slumps as oil prices surge, US CPI data awaited
- The Indian Rupee trades sharply lower against the US Dollar, with USD/INR rising to near 96.20.
- Oil prices and US Treasury yields surge as the US claims toll rights on ships passing the Strait of Hormuz.
- Investors await US CPI data and Fed Chair Warsh’s testimony.

The Indian Rupee trades significantly lower against the US Dollar (USD) on Tuesday. The USD/INR pair posts a fresh seven-week high near 96.20 as surging oil prices and United States (US) Treasury Yields due to threats of levy from Washington have weakened the appeal of the Indian currency.
In the opening session, the MCX Crude Oil contract expiring on July 20 opens 4.24% higher to near Rs. 7,673, the highest level seen in almost a month. Currencies from economies, such as India, which rely heavily on oil imports to meet their energy needs, tend to underperform in a high oil price environment.
As of writing, 10-year US Treasury Yields are up 0.3% to near 4.62%, approaching their 18-month high of 4.66%. The scenario of higher US bond yields bodes poorly for risky assets.
Trump’s levy threat sends oil prices and bond yields higher
On Monday, US President Donald Trump announced, through a post on Truth Social, that Washington is reinstating the US blockade on Iranian sea ports, aiming to stop Iranian ships and customers from leaving or entering. The US lifted its Iranian blockade after signing a memorandum of understanding (MoU), which had collapsed due to the exchange of attacks between them.
US President Trump also said in a media post that Washington will charge a 20% fee on all cargo ships traversing the Strait of Hormuz, a critical chokepoint for almost one-fifth of global energy supply, calling it a reimbursement for providing safety and security near the waterway. Trump also declared the US “The Guardian of the Hormuz Strait”.
FIIs remained net sellers on Monday
Foreign Institutional Investors (FIIs) remained net sellers on Monday, offloading their stake worth Rs. 3,062.27 crore. Rising oil prices due to Middle East aggression appear to have dented the sentiment of overseas investors toward the Indian stock market again. However, they are still net buyers so far this month and have invested Rs. 1,510.62 crore.
US CPI data comes into spotlight
Later in the day, investors will pay close attention to the US Consumer Price Index (CPI) data for June and Federal Reserve (Fed) Chairman Kevin Warsh’s two-day testimony. Investors will pay close attention to both events to get fresh cues regarding the US interest rate outlook.
On Monday, Fed Governor Christopher Waller said that another hot inflation figure would be treated as “signal, not noise" on the need to tighten monetary conditions further.
According to estimates, the US headline CPI growth cooled down to 3.8% Year-on-Year (YoY) in June from 4.2% in May, with core figures rising steadily by 2.9%.
Technical Analysis: USD/INR holds firmly above 20-day EMA
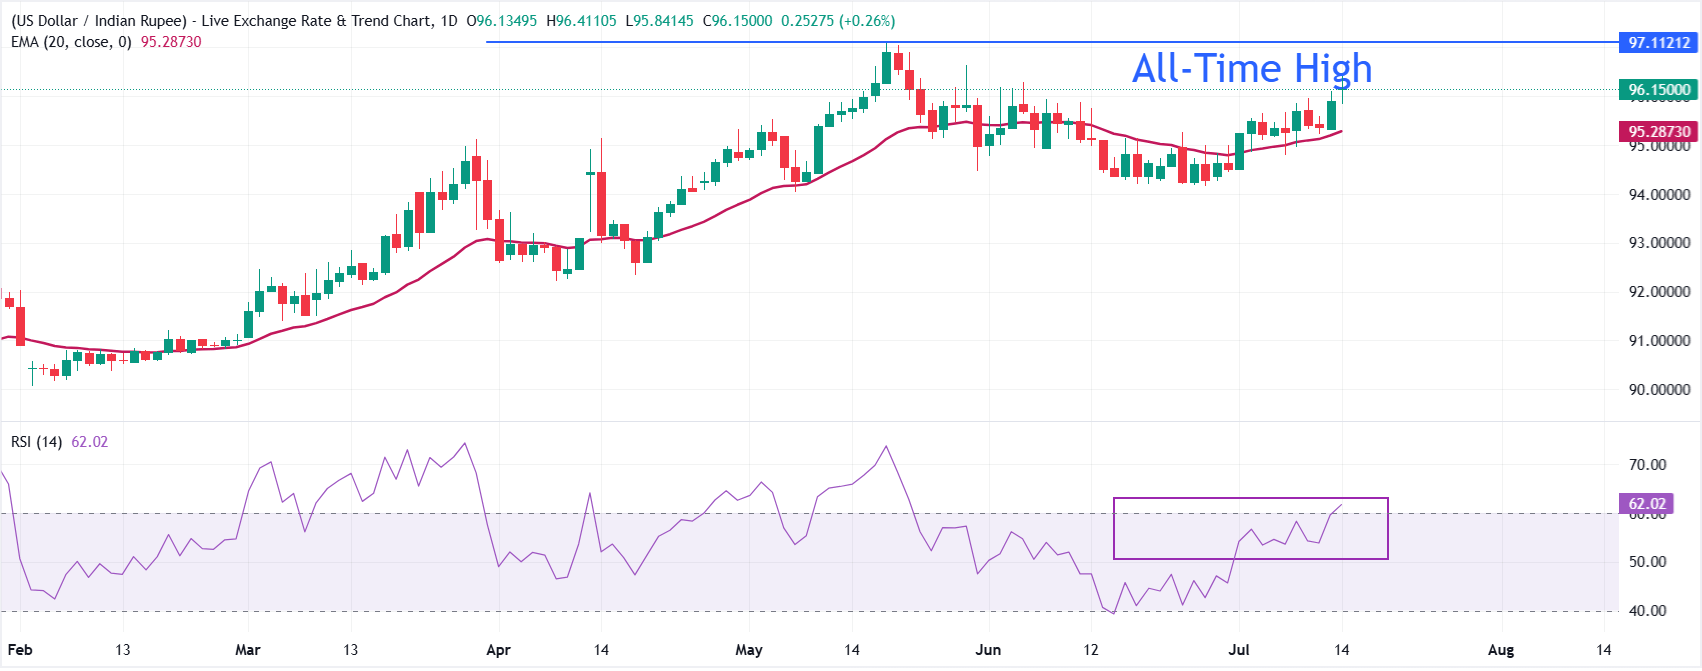
USD/INR trades higher at around 96.12 at press time. The pair holds above the 20-period exponential moving average (EMA) at 95.2840, keeping a constructive bullish bias as price extends away from dynamic trend support.
The Relative Strength Index (RSI) at 61.69 leans into positive territory, suggesting firm upward momentum rather than overbought excess.
On the downside, immediate support is seen at the 20-period EMA near 95.28, followed by 95.00. Looking up, the pair aims to revisit the all-time high at 97.10.
(The technical analysis of this story was written with the help of an AI tool. Know more.)
Economic Indicator
Consumer Price Index ex Food & Energy (YoY)
Inflationary or deflationary tendencies are measured by periodically summing the prices of a basket of representative goods and services and presenting the data as the Consumer Price Index (CPI). CPI data is compiled on a monthly basis and released by the US Department of Labor Statistics. The YoY reading compares the prices of goods in the reference month to the same month a year earlier. The CPI Ex Food & Energy excludes the so-called more volatile food and energy components to give a more accurate measurement of price pressures. Generally speaking, a high reading is bullish for the US Dollar (USD), while a low reading is seen as bearish.
Read more.Next release: Tue Jul 14, 2026 12:30
Frequency: Monthly
Consensus: 2.8%
Previous: 2.9%
Source: US Bureau of Labor Statistics
The US Federal Reserve has a dual mandate of maintaining price stability and maximum employment. According to such mandate, inflation should be at around 2% YoY and has become the weakest pillar of the central bank’s directive ever since the world suffered a pandemic, which extends to these days. Price pressures keep rising amid supply-chain issues and bottlenecks, with the Consumer Price Index (CPI) hanging at multi-decade highs. The Fed has already taken measures to tame inflation and is expected to maintain an aggressive stance in the foreseeable future.
Author

Sagar Dua
FXStreet
Sagar Dua is associated with the financial markets from his college days. Along with pursuing post-graduation in Commerce in 2014, he started his markets training with chart analysis.
















