|

India Faces Rupee (USD/INR) pause before renewed slide

The Indian rupee (USDINR) has faced steady pressure in 2025 due to global uncertainty and rising import costs. Higher oil prices and reduced foreign investment have made the currency weaker. The Reserve Bank of India has limited its support, allowing more market-driven movement. As a result, the rupee has dropped closer to 91 against the U.S. dollar. This trend has raised costs for imported goods and added stress to inflation. Exporters benefit from a weaker rupee, but consumers feel the pinch. Businesses that rely on foreign parts or services also face higher expenses.

Looking ahead to 2026, experts expect the rupee to stay under pressure. If global interest rates remain high, foreign funds may continue to leave India. However, strong service exports and digital growth could help slow the decline. The RBI may act carefully to avoid sharp swings. If India boosts manufacturing and keeps inflation in check, the rupee could find more balance by year-end. Analysts also watch global oil prices and trade deals closely. These factors will shape how the rupee performs in the months to come.

Elliott Wave forecast: USD/INR monthly chart May 2025

Chart

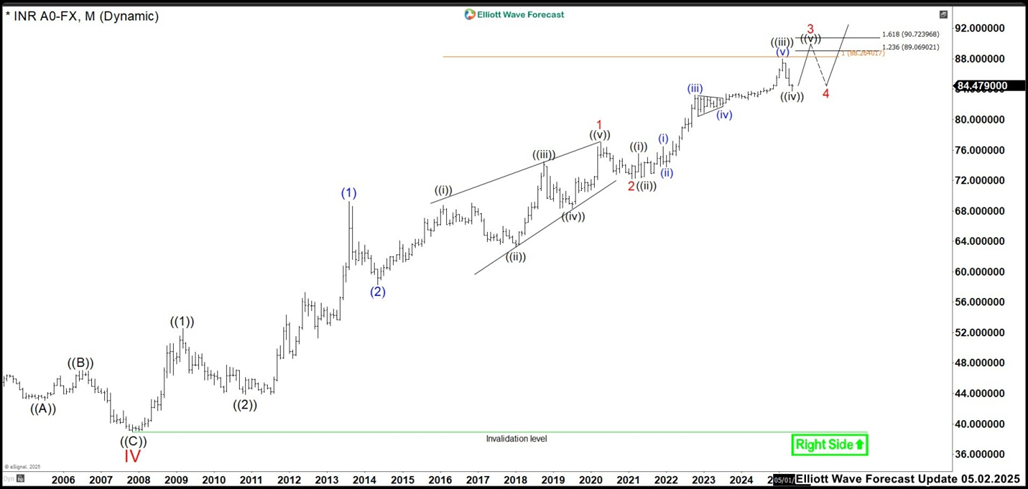
In the last update, wave (v) of ((iii)) had reached 87.97, missing its target by 29 cents before reversing lower. Wave ((iv)) then corrected sharply, nearly hitting the 100% Fibonacci extension at 83.76, and rebounded with strength—suggesting that wave ((iv)) had likely completed. This setup pointed to a continued rise in USDINR through wave ((v)), with a projected target between 89.06 and 90.72, assuming no further extensions. Cue

Elliott Wave forecast: USD/INR monthly chart October 2025

Chart

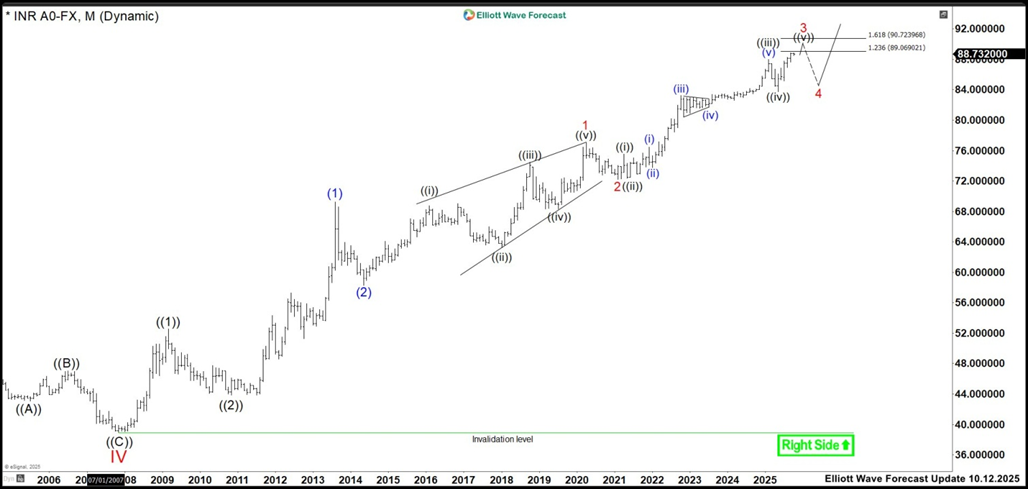
Currently, the rupee is near to reach the extreme area to end wave ((v)) of 3. In that resistance zone, the dollar’s strength was expected to be rejected, marking the end of wave 3 and the beginning of wave 4. Then, that wave 4 would retest the support of wave ((iv)) before wave 5 resumed the bullish trend. This sequence was expected to confirm the broader upward structure and reinforce the long-term bullish outlook for USDINR. Let’s see if there is not an extension in this wave ((v)) of 3 to start a new pullback.

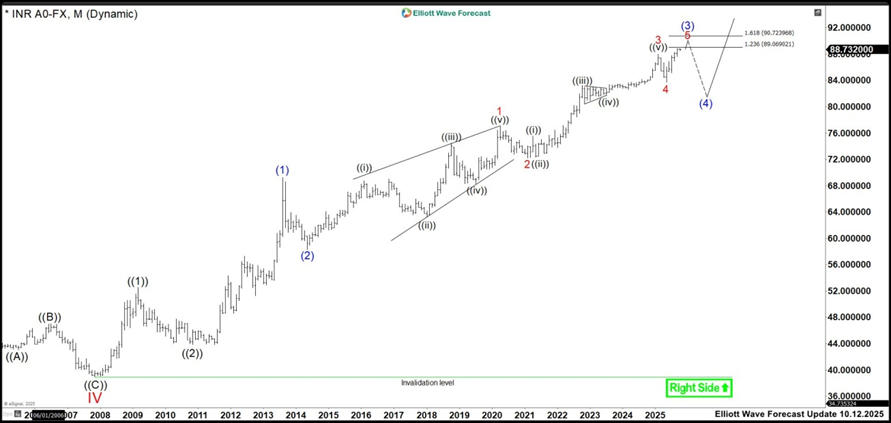
Elliott Wave forecast: USDINR Monthly chart October 2025 alternative

Chart

Author

Elliott Wave Forecast Team

Elliott Wave Forecast Team

ElliottWave-Forecast.com

More from Elliott Wave Forecast Team
Share:

Editor's Picks

EUR/USD weakens as US jobs data trims Fed rate cut bets

The EUR/USD pair trades in negative territory for the third consecutive day near 1.1860 during the early European session on Thursday. Traders will keep an eye on the US weekly Initial Jobless Claims data. On Friday, the attention will shift to the US Consumer Price Index inflation report. 

GBP/USD bullish outlook prevails above 1.3600, UK GDP data looms

The GBP/USD pair gains ground near 1.3635, snapping the two-day losing streak during the early European session on Thursday. The preliminary reading of UK Gross Domestic Product for the fourth quarter will be closely watched later on Thursday. The UK economy is estimated to grow 0.2% QoQ in Q4, versus 0.1% in Q1. 

Gold remains on the defensive below two-week top; lacks bearish conviction amid mixed cues

Gold sticks to modest intraday losses through the Asian session on Thursday, though it lacks follow-through selling and remains close to a nearly two-week high, touched the previous day. The commodity currently trades above the $5,070 level, down just over 0.20% for the day, amid mixed cues.

UK GDP set to post weak growth as markets rise bets on March rate cut

Markets will be watching closely on Thursday, when the United Kingdom’s Office for National Statistics will release the advance estimate of Q4 Gross Domestic Product. If the data land in line with consensus, the UK economy would have continued to grow at an annualised pace of 1.2%, compared with 1.3% recorded the previous year. 

The market trades the path not the past

The payroll number did not just beat. It reset the tone. 130,000 vs. 65,000 expected, with a 35,000 whisper. 79 of 80 economists leaning the wrong way. Unemployment and underemployment are edging lower. For all the statistical fog around birth-death adjustments and seasonal quirks, the core message was unmistakable. The labour market is not cracking.

Sonic Labs’ vertical integration fuels recovery in S token

Sonic, previously Fantom (FTM), is extending its recovery trade at $0.048 at the time of writing, after rebounding by over 12% the previous day. The recovery thesis’ strengths lie in the optimism surrounding Sonic Labs’ Wednesday announcement to shift to a vertically integrated model, aimed at boosting S token utility.