|

Impulsive Elliott Wave decline in FTSE 100 calling more downside [Video]

FTSE ended cycle from 3.16.2020 low with wave I at 8047.06. The Index is now in the process of correcting this 3 year rally in wave II. The internal subdivision of wave II is unfolding as a zigzag Elliott Wave structure. A zigzag structure is a 5-3-5 structure with ((A))-((B))-((C)) as the label. Wave ((A)) and ((C)) in this case subdivides into 5 waves impulse. In the 1 hour chart below, FTSE is still within wave ((A)) of II with subdivision as 5 waves. Down from wave I, wave 1 ended at 7978.61 and wave 2 ended at 8020.13.

FTSE 60 minutes hour Elliott Wave chart

Chart

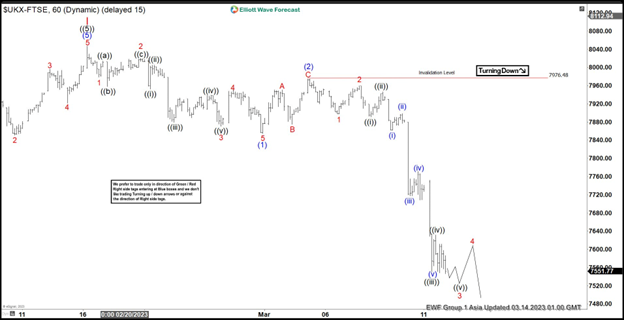
The Index then resumes lower in wave 3 towards 7870.39, and wave 4 ended at 7949.97. Final leg lower wave 5 ended at 7854.82 which completed wave (1). Rally in wave (2) ended at 7976.48 with subdivision as a zigzag structure. Up from wave (1), wave A ended at 7950.69 and pullback in wave B ended at 7875.03. Wave C higher ended at 7976.48 which completed wave (2). The Index resumes lower in wave (3). Down from wave (2), wave 1 ended at 7897.45 and rally in wave 2 ended at 7959.77. Expect the Index to extend lower 1 more time to end wave 3, then it should rally in wave 4 and extends lower again. Near term, as far as pivot at 7976.48 high stays intact, expect rally to fail in 3, 7, or 11 swing.

FTSE Elliott Wave video

Author

Elliott Wave Forecast Team

Elliott Wave Forecast Team

ElliottWave-Forecast.com

More from Elliott Wave Forecast Team
Share:

Editor's Picks

EUR/USD holds steady above 1.1850 in quiet session

EUR/USD stays defensive but holds 1.1850 amid quiet markets in the European hours on Monday.  The US Dollar is struggling for direction due to thin liquidity conditions as US markets are closed in observance of Presidents' Day holiday. 

GBP/USD flat lines near 1.3650 ahead of UK and US data

GBP/USD kicks off a new week on a subdued note and oscillates in a narrow range near 1.3650 on Monday. The mixed fundamental backdrop warrants some caution for aggressive traders as the market focus now shifts to this week's important data releases from the UK and the US.

Gold corrects lower, tries to stabilize above $5,000

Gold started the week under bearish pressure and declined to the $4,960 area before staging a modest rebound. As trading volumes remain thin with the US financial markets remaining closed on Presidents' Day holiday, XAU/USD looks to stabilize above $5,000 ahead of this week's key data releases.

Bitcoin consolidates as on-chain data show mixed signals

Bitcoin price has consolidated between $65,700 and $72,000 over the past nine days, with no clear directional bias. US-listed spot ETFs recorded a $359.91 million weekly outflow, marking the fourth consecutive week of withdrawals.

The week ahead: Key inflation readings and why the AI trade could be overdone

It is likely to be a quiet start to the week, with US markets closed on Monday for Presidents Day. European markets are higher across the board and gold is clinging to the $5,000 level after the tamer than expected CPI report in the US reduced haven flows to precious metals.

Monero Price Forecast: XMR risks a drop below $300 under mounting bearish pressure

Monero (XMR) starts the week under pressure, recording a 4% decline at press time on Monday after a 7% drop the previous day, putting the $300 support zone in focus.