IBEX 35 (Spain) Index Elliott Wave technical analysis [Video]
![IBEX 35 (Spain) Index Elliott Wave technical analysis [Video]](https://editorial.fxstreet.com/images/Markets/Equities/Ibex/bolsa-de-madrid-15680575_XtraLarge.jpg)
IBEX 35 (Spain) Elliott Wave Analysis Trading Lounge.
IBEX 35 (Spain) Elliott Wave Technical Analysis.
Technical analysis summary
- Function: Counter Trend.
-
Mode: Corrective.
-
Structure: Gray wave 2.
-
Position: Orange wave 3.
-
Direction next higher degrees: Gray wave 3.
-
Details: Gray wave 1 appears completed. Currently, gray wave 2 of orange wave 3 is in progress.
-
Wave cancel invalidation level: 10,289.18.
Analysis overview
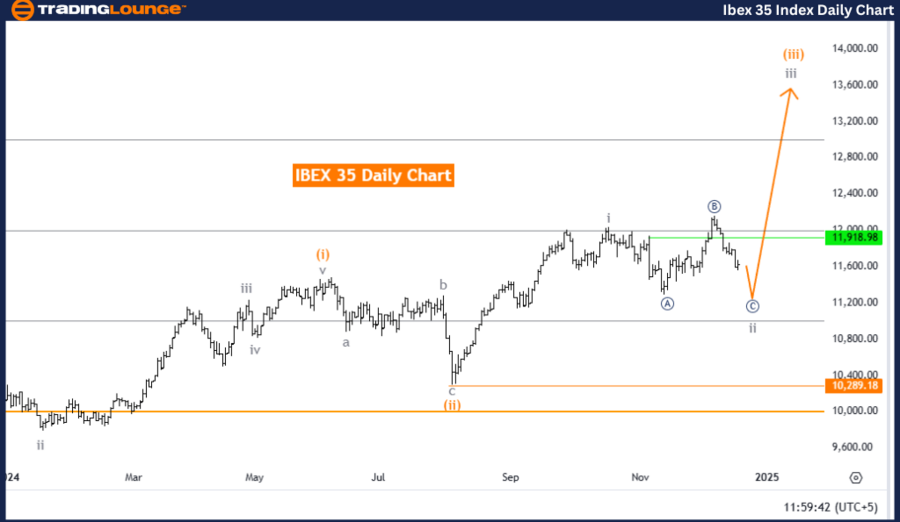
The IBEX 35 daily chart reveals a counter-trend movement in line with the Elliott Wave framework. The focus is on a corrective wave structure, gray wave 2, within the broader orange wave 3. This wave pattern highlights a temporary consolidation phase within the market's larger trend.
Wave dynamics
- Gray wave 1 is identified as completed, marking the initial phase of the impulsive sequence.
- Currently, gray wave 2 is developing, functioning as a corrective wave that retraces part of the prior upward movement of gray wave 1.
- This corrective phase prepares the market for the resumption of the larger impulsive trend.
Higher degree wave outlook
The next higher degree wave, gray wave 3, signals a potential return to bullish momentum upon the completion of gray wave 2. The temporary pause suggested by gray wave 2 aligns with the market's overall consolidation before continuing the larger trend.
Critical threshold
The wave cancel invalidation level is set at 10,289.18. A price fall below this threshold would invalidate the current wave count and require a reassessment of the Elliott Wave structure.
Conclusion
In summary, the IBEX 35 daily chart illustrates a counter-trend scenario with gray wave 2 currently underway. Following the completion of gray wave 1, this corrective phase sets the stage for the continuation of the upward trend in gray wave 3. The analysis highlights temporary market dynamics while preparing for the resumption of the larger bullish trend, consistent with the principles of Elliott Wave theory. The identified invalidation level acts as a critical benchmark for validating this wave structure.
IBEX 35 (Spain) Elliott Wave Analysis Trading Lounge Weekly Chart.
IBEX 35 (Spain) Elliott Wave Technical Analysis.
Technical analysis summary
-
Function: Counter Trend.
-
Mode: Corrective.
-
Structure: Gray wave 2.
-
Position: Orange wave 3.
-
Direction next higher degrees: Gray wave 3.
-
Details: Gray wave 1 appears completed. Currently, gray wave 2 of orange wave 3 is in progress.
-
Wave cancel invalidation level: 10,289.18.
Analysis overview
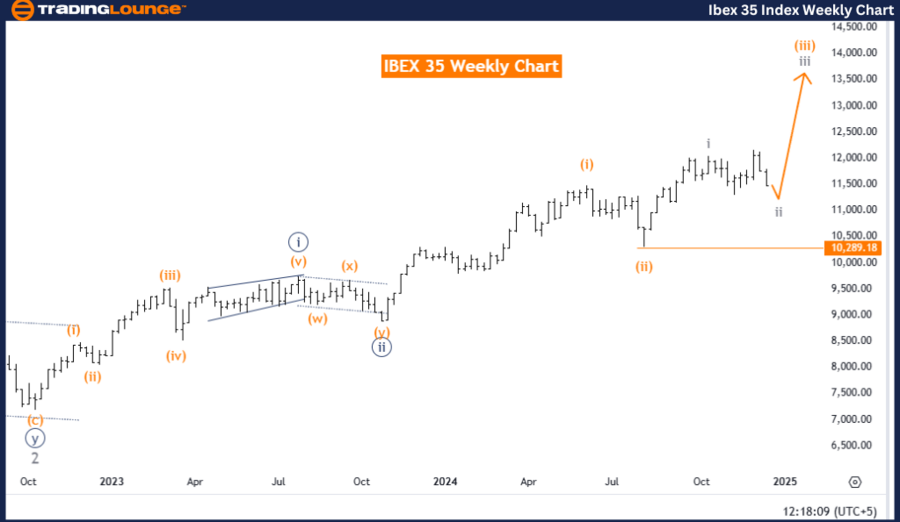
The IBEX 35 weekly chart highlights a counter-trend scenario in line with Elliott Wave principles. The focus is on a corrective wave structure, specifically gray wave 2, which forms part of the broader orange wave 3. This wave structure indicates a temporary pause or retracement within a larger impulsive sequence.
Wave dynamics
- The completion of gray wave 1 marks the initial phase of this corrective pattern.
- Currently, gray wave 2 is unfolding, representing a pullback that typically occurs before the next impulsive movement in the trend.
- This phase is essential in establishing a solid foundation for the anticipated continuation of the upward trend with gray wave 3.
Higher degree wave outlook
The next higher degree wave, gray wave 3, indicates a potential return to bullish momentum once gray wave 2 concludes. This retracement reflects the market’s preparation for the next impulsive phase within the broader trend.
Critical threshold
The wave cancel invalidation level is identified at 10,289.18. A price movement below this threshold would invalidate the current wave count, requiring a reassessment of the Elliott Wave structure. This level is a key benchmark for maintaining the validity of the ongoing analysis.
Conclusion
In summary, the IBEX 35 weekly chart depicts a counter-trend phase, with gray wave 2 actively developing following the completion of gray wave 1. This corrective phase, part of the broader orange wave 3 structure, sets the stage for a potential continuation of the upward trend in gray wave 3. The analysis underscores the importance of the identified invalidation level as a critical measure for confirming the current wave pattern and ensuring the integrity of the Elliott Wave count.
IBEX 35 (Spain) Index Elliott Wave technical analysis [Video]
Author

Peter Mathers
TradingLounge
Peter Mathers started actively trading in 1982. He began his career at Hoei and Shoin, a Japanese futures trading company.


