IBEX 35 (Spain) Elliott Wave technical analysis [Video]
![IBEX 35 (Spain) Elliott Wave technical analysis [Video]](https://editorial.fxstreet.com/images/Markets/Equities/Ibex/madrid-stock-exchange-spain-eu-16703960_XtraLarge.jpg)
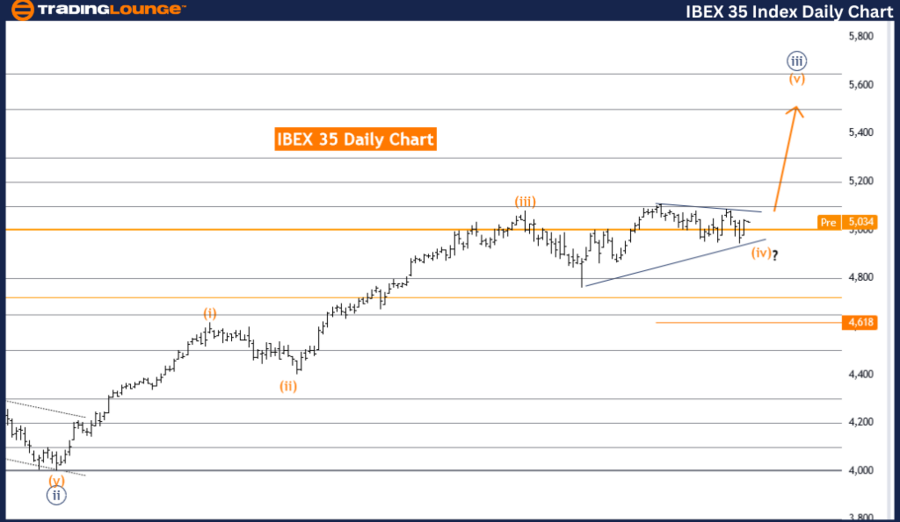
IBEX 35 (Spain) Elliott Wave Analysis Trading Lounge Day Chart,
IBEX 35 (Spain) Elliott Wave technical analysis
Function: Trend.
Mode: Corrective.
Structure: Orange wave 4.
Position: Navy blue wave 3.
Direction next higher degrees: Orange wave 5.
Details: Orange wave 4 still is in play and looking near to end.
Wave cancel invalid level: 4618.
The IBEX 35 Elliott Wave analysis on the daily chart is primarily concerned with tracking the trend within the market using a corrective mode. The current wave structure is identified as orange wave 4, positioned within the larger context of navy blue wave 3. This suggests the market is undergoing a corrective phase before transitioning to the next upward wave.
The main function of this analysis is to monitor the trend within the IBEX 35 market. The corrective nature of the mode indicates that the market is currently adjusting within orange wave 4. This wave is part of the broader trend, positioned within navy blue wave 3, highlighting the temporary nature of the correction before resuming the upward movement.
The direction for the next higher degrees is identified as orange wave 5. This indicates that once orange wave 4 completes, the market is expected to transition into the upward phase of orange wave 5, continuing the overall trend.
Details in the analysis emphasize that orange wave 4 is still ongoing but is approaching its end. This signifies that the corrective phase is nearing completion, and the market is preparing to shift into the next phase, which is orange wave 5. This upcoming wave will resume the upward trend following the completion of the current correction.
A critical aspect of this analysis is the wave cancel invalid level, set at 4618. This level is vital for maintaining the validity of the current wave count. If the market price drops below this level, the existing wave structure would be invalidated, requiring a reassessment of the Elliott Wave analysis and potentially altering the expected market direction.
In summary, the IBEX 35 daily chart analysis indicates that the market is in the final stages of a corrective phase within orange wave 4, part of the broader navy blue wave 3. Upon the completion of orange wave 4, the market is expected to enter the upward phase of orange wave 5, continuing the overall trend. The wave cancel invalid level at 4618 is crucial for confirming the current wave count and guiding future market expectations based on Elliott Wave principles.
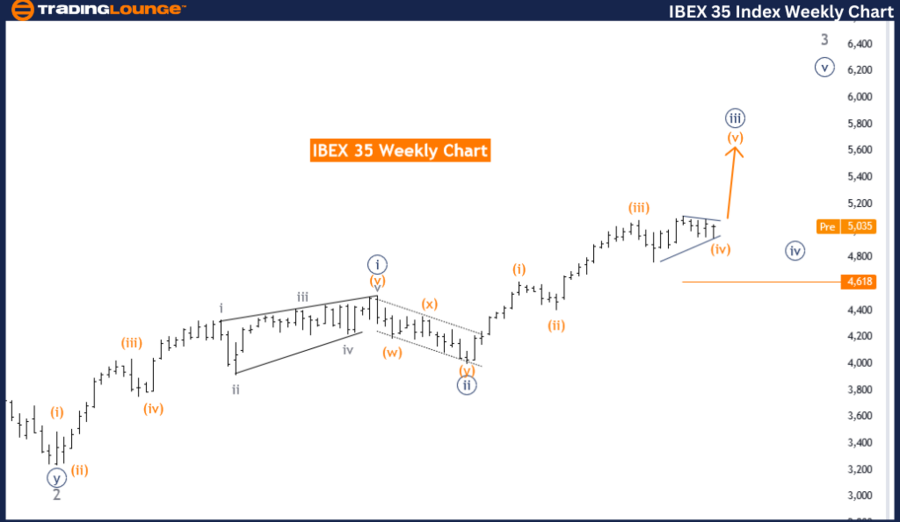
IBEX 35 (Spain) Elliott Wave analysis weekly chart
Function: Trend
Mode: Corrective
Structure: Orange wave 4
Position: Navy blue wave 3
Direction next higher degrees: Orange wave 5
Details: Orange wave 4 still is in play and looking near to end.
Wave cancel invalid level: 4618
The IBEX 35 Elliott Wave analysis on the weekly chart focuses on identifying and tracking the trend within the market using a corrective mode. The current wave structure is characterized as orange wave 4, which is positioned within the broader context of navy blue wave 3. This indicates that the market is undergoing a correction within an overall upward trend.
The primary function of this analysis is to observe and interpret the trend behavior in the IBEX 35 market. The corrective mode signifies that the market is currently in a phase of adjustment, specifically within orange wave 4. This wave is part of the larger trend and indicates a temporary pause or retracement in the ongoing upward movement represented by navy blue wave 3.
The analysis points to the next higher degrees direction as orange wave 5. This suggests that following the completion of the current corrective phase in orange wave 4, the market is expected to transition into the next upward phase, known as orange wave 5. This transition will continue the overall trend, resuming the upward movement.
Detailed observations in the analysis highlight that orange wave 4 is still active but nearing its end. This means the current corrective phase is almost complete, and the market is preparing to move into orange wave 5. This upcoming wave will mark the continuation of the upward trend following the correction.
An important aspect of this analysis is the wave cancel invalid level, which is set at 4618. This level serves as a critical point for maintaining the validity of the current wave structure. If the market price falls below this level, the current wave count would be invalidated, necessitating a reassessment of the Elliott Wave analysis and potentially altering the market outlook.
In summary, the IBEX 35 weekly chart analysis indicates that the market is in the final stages of a corrective phase within orange wave 4, which is part of the larger navy blue wave 3. Once orange wave 4 is complete, the market is expected to shift into the upward phase of orange wave 5, continuing the overall trend. The wave cancel invalid level at 4618 is crucial for confirming the current wave count and guiding future market expectations based on Elliott Wave principles.
IBEX 35 (Spain) Elliott Wave technical analysis [Video]
Author

Peter Mathers
TradingLounge
Peter Mathers started actively trading in 1982. He began his career at Hoei and Shoin, a Japanese futures trading company.


