HubSpot Stock Forecast: HUBS is down 47% in 7 weeks, but it can go lower
- HubSpot was one of the best stocks to own during the COVID-19 pandemic.
- HUBS has now plunged 47% since November 30.
- HubSpot may find support as low as $347.

When one of the names in your portfolio would have to run up 37% just to reach the 200-day moving average, you might be in a bit of a pickle. That is the situation with HubSpot (HUBS), the beloved customer management software provider that exploded 853% from the pandemic's March 2020 lows but in the space of just a month and a half has lost nearly half its value.
HubSpot Stock News: valuation up in smoke
Things were peachy for this star SaaS stock when on November 30, 2020, it grasped at its all-time high of $866. In December as many hedge funds began to dispose of their star picks in order to lock-in gains, HUBS began to slide. Then in late December, hedge fund Kerrisdale Capital issued a short report listing what it thought were HubsSpot's weak points. First, it pointed to the company's steep valuation (more than 20x enterprise value at the time), saying that the company's software offering lacked any competitive edge. Then it pointed to the large number of founding executives that have left the company in the past year and ragged on the firm for failing to be profitable after 16 years in business.
On the flipside, HubSpot stock still sports an analyst price target of $833.88 – 83% above the current share price of $456. January, however, has seen growth investors competely sell out of HUBS as the Federal Reserve is expected to raise interest rates several times this year. In a rising interest rate environment, investors are less attracted to companies that are losing money.
HUBS key statistics
| Market Cap | $22 billion |
| Price/Earnings | N/A |
| Price/Sales | 18 |
| Quarterly Revenue Growth (YoY) | 48.5% |
| Enterprise Value | $21 billion |
| Operating Margin | -5% |
| Profit Margin |
-7% |
| 52-week high | $866 |
| 52-week low | $347.78 |
| Short Interest | 5% |
| Average Wall Street Rating and Price Target | Buy, $833.88 |
HubSpot Stock Forecast: $347 in sight
On the daily chart, the long red candles that have been the norm this January showcase a stock that is getting the cold shoulder from a large segment of the market. Now down almost 50% in seven weeks, no suddent change in sentiment appears on the horizon. There is not a single reason to think this is the bottom for HUBS.
The 200-day moving average is all the way up at $636. The 50-day moving average only recently crossed below the 100-day moving average on January 13. Additionally, the Moving Average Convergence Divergence (MACD) indicator does not yet show a bottom forming.
The nearest part of the chart that may provide support is March 8, 2021, with the low of $418.51. This price also held up fairly well throughout that month. Below here, HUBS would need to descend to $347.78. This level served as support in November 2020 and January 2021. With continued interest rates hikes likely to be in the news all year, here at FXStreet we think this level is the price to wait for.
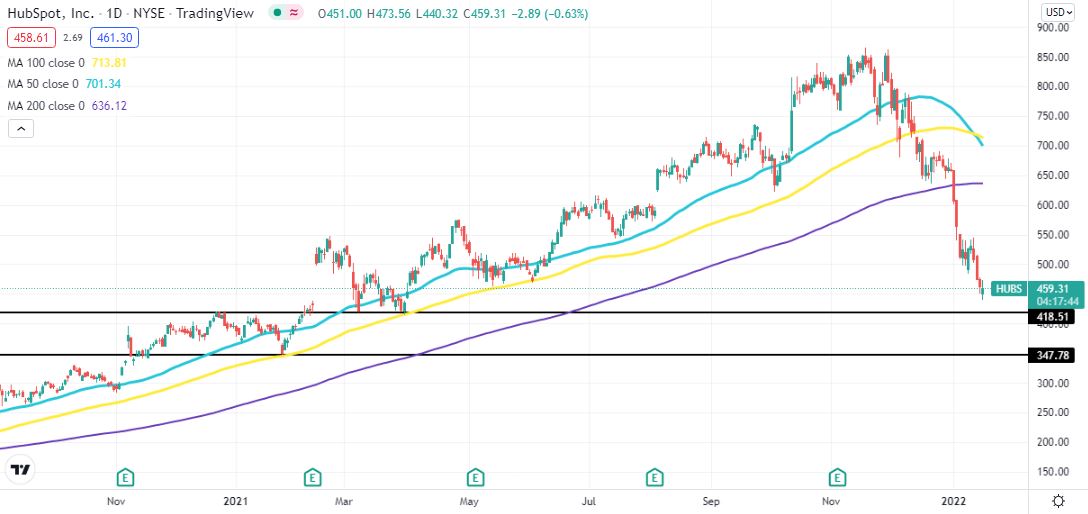
HUBS 1-day chart
Like this article? Help us with some feedback by answering this survey:
Premium
You have reached your limit of 3 free articles for this month.
Start your subscription and get access to all our original articles.
Author

Clay Webster
FXStreet
Clay Webster grew up in the US outside Buffalo, New York and Lancaster, Pennsylvania. He began investing after college following the 2008 financial crisis.


