How we saw Caterpillar Inc (CAT Stock) and what to expect in coming months

Caterpillar Inc. (often shortened to CAT) is an American Fortune 100 corporation that designs, develops, engineers, manufactures, markets, and sells machinery, engines, financial products, and insurance to customers via a worldwide dealer network. It is the world’s largest construction- equipment manufacturer. Caterpillar stock is a component of the Dow Jones Industrial Average.
Caterpillar November 28th daily chart
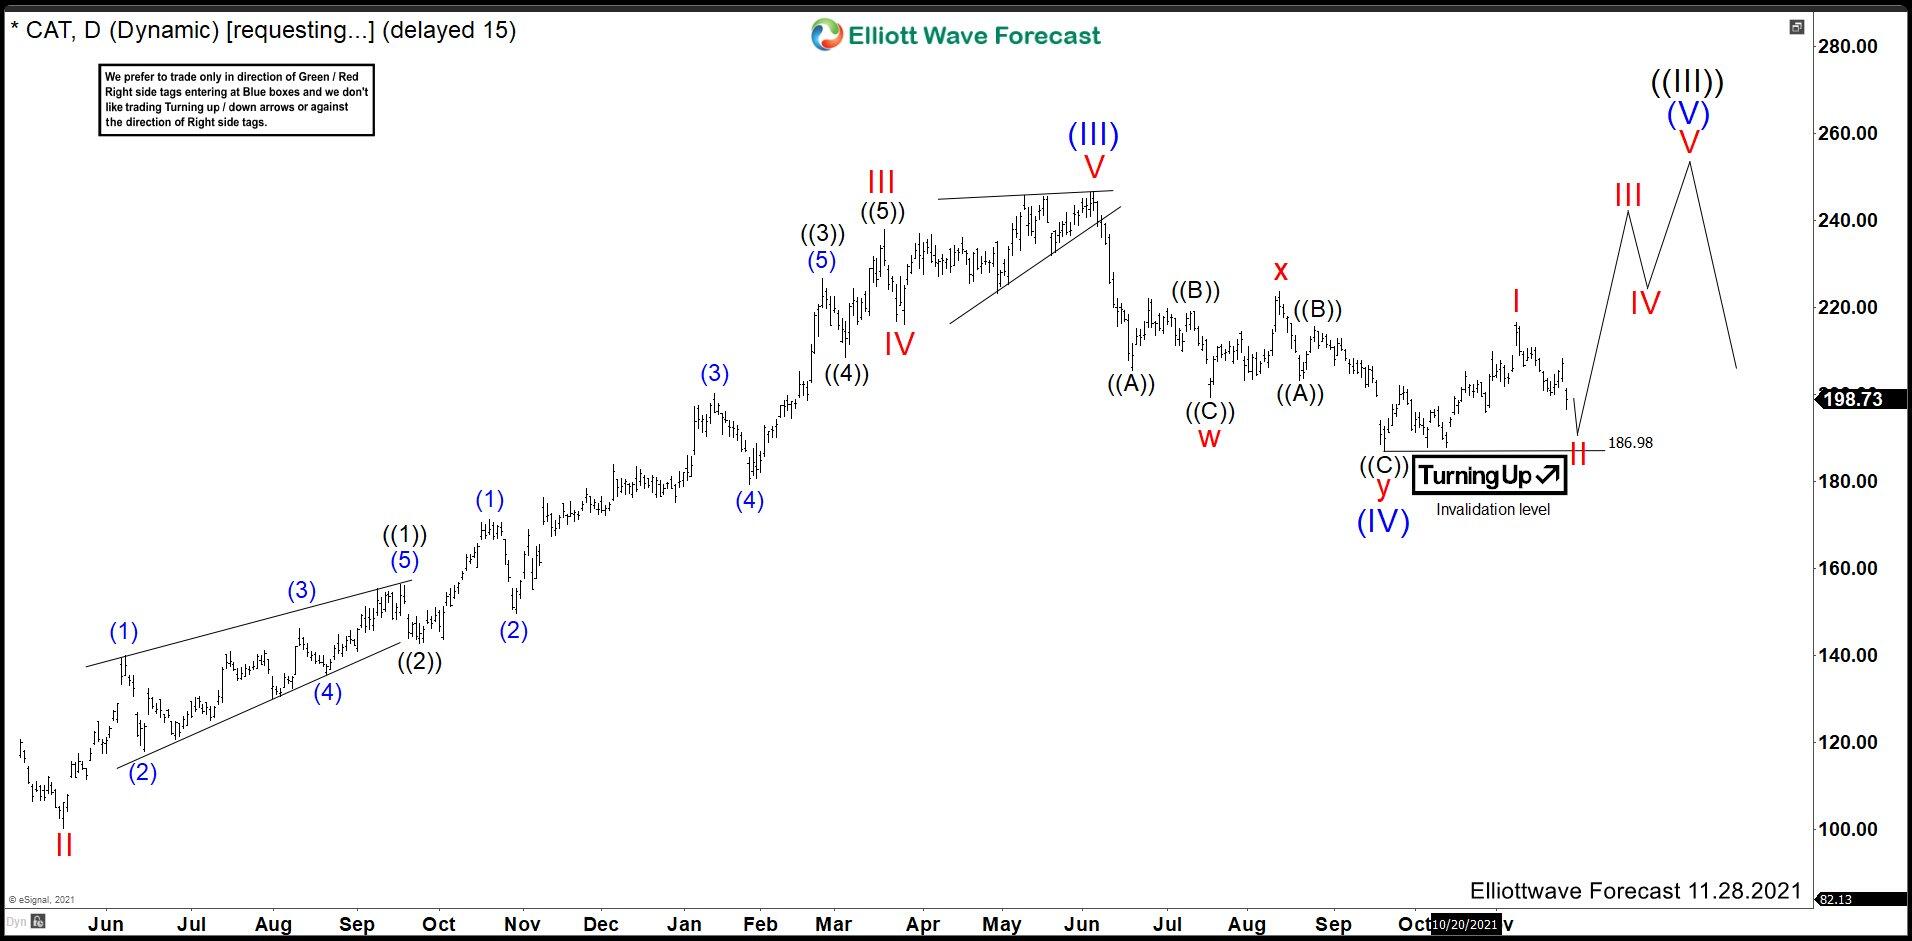
At the beginning, we labeled an impulse structure from Jan 2016 low that ended at 173.24 in Jan 2018 as wave (I). Then Caterpillar made a pullback and built a zig-zag structure ending wave (II) at 87.50 in March 2020 when the COVID pandemic spread worldwide.
A bounce appeared in that year and we started to develop wave (III). We could see in the chart above wave (III) structure that ended at 246.69 in May 2021. Thus, another pullback began making a double correction structure and we called wave (IV) ended at 186.98. From here, we were looking for a last impulse to break wave (III) peak and complete the impulse structure from 2016 as wave (V).
Caterpillar December 26th daily chart
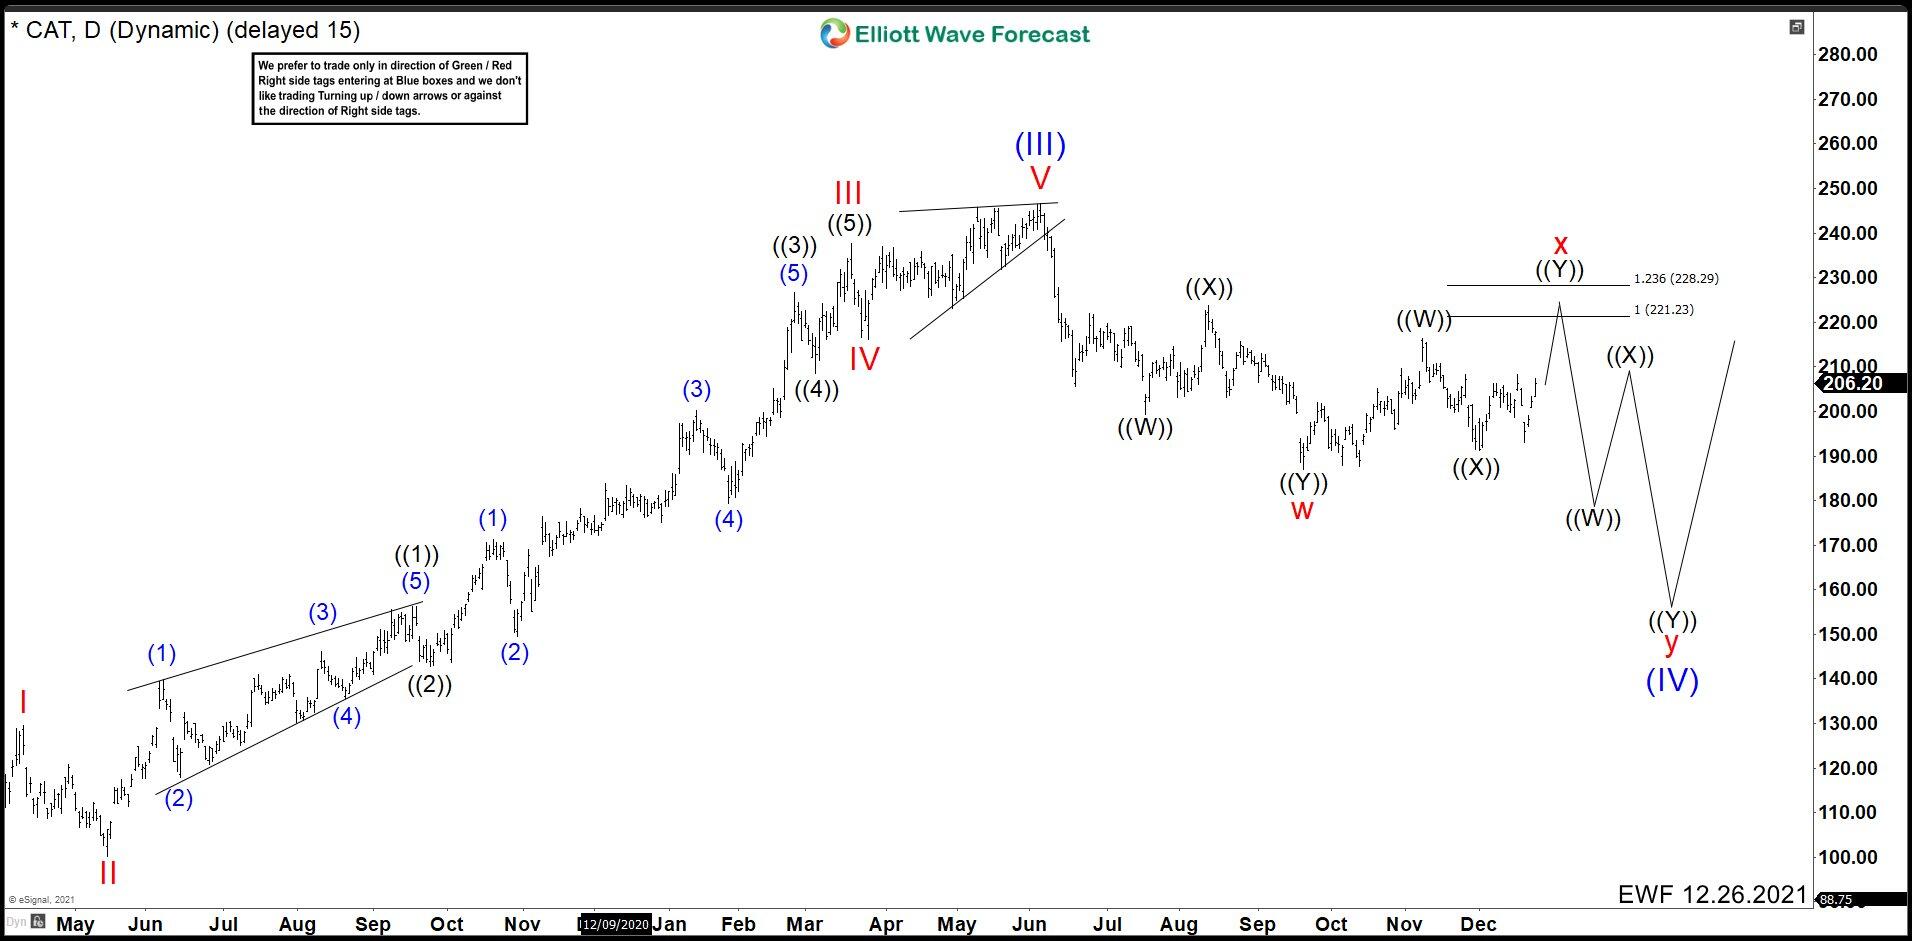
After Christmas, we analyzed the world capital market and realized that it was close to make a major correction and it was better to forget about looking for wave (V) and rather, it was better to look for a continuation of wave (IV) with a more complex double correction. For this reason, we deleted the impulse forecast in Caterpillar and changed it to a double correction to complete wave X formed by waves ((W)), ((X)), and ((Y)). Using the Fibonacci tool, we suggested the 221.00 – 228.00 zone as a possible area where wave X should end and continue declining.
Caterpillar January 7th 2022 daily chart
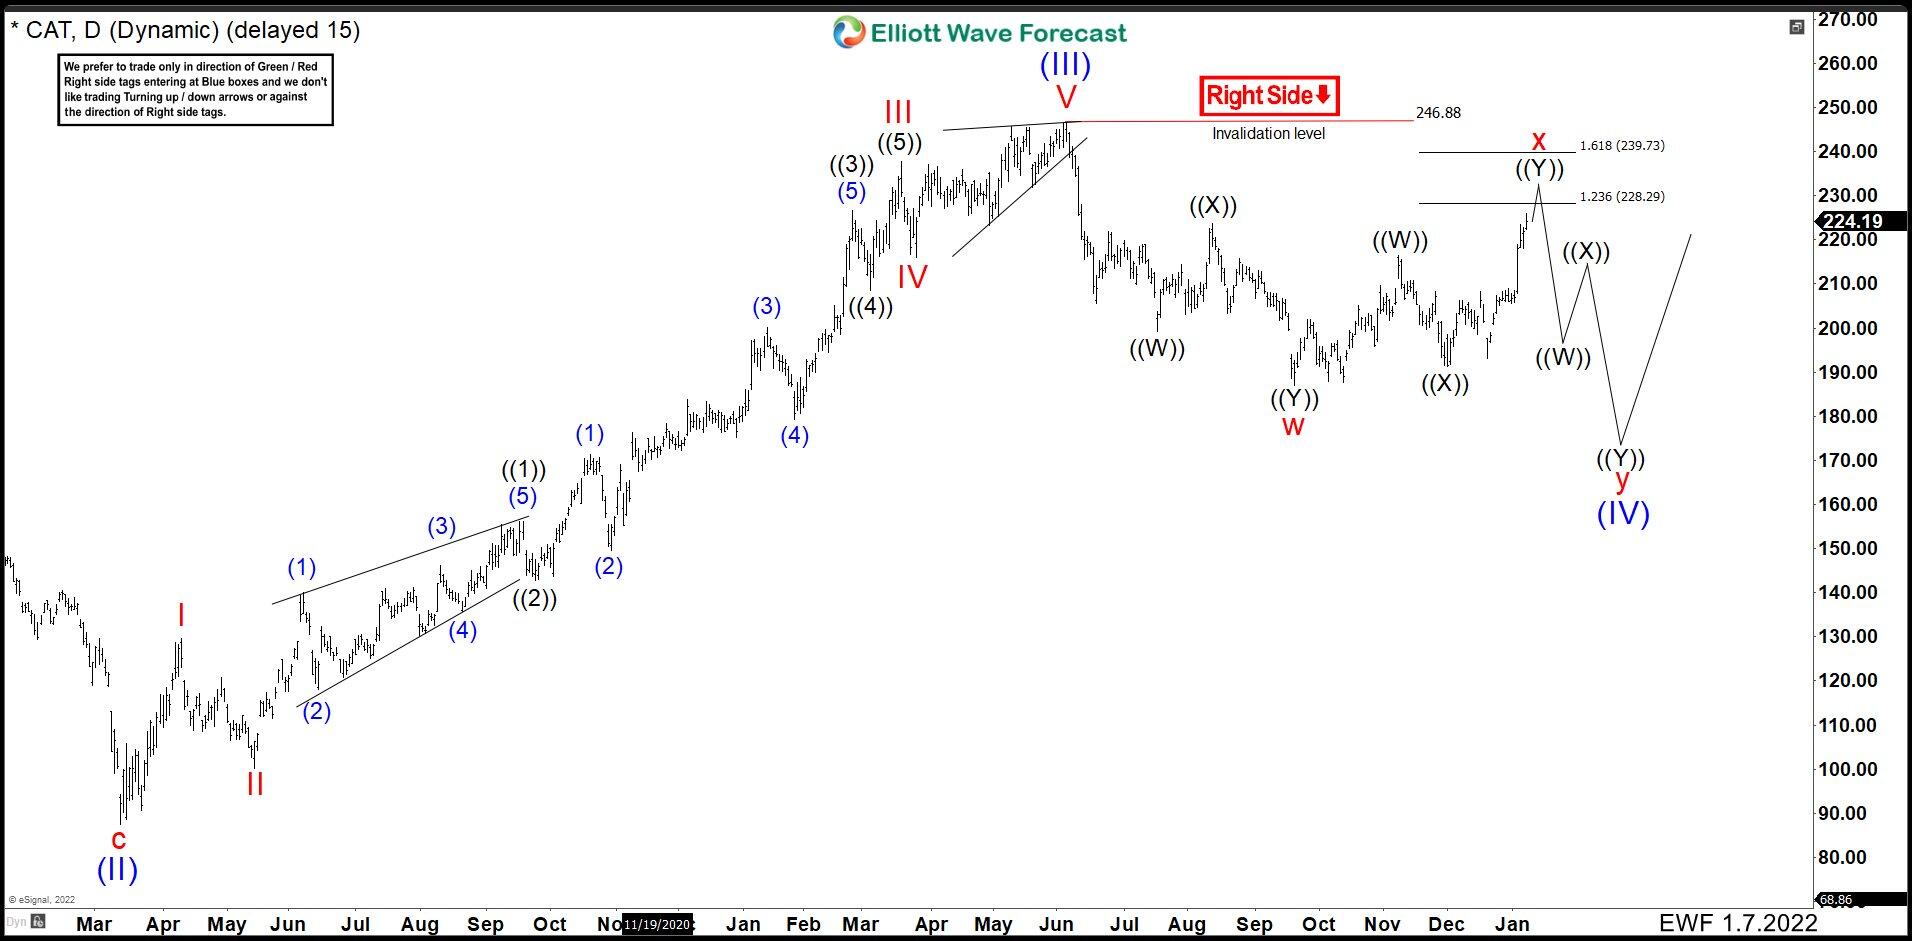
The wave ((W)) ended at 216.47 then pullback wave ((X)) ended at 191.36. Wave ((Y)) started slow, but it moved strong high at the beginning of 2022.The internal structure in lesser degree was a flat correction (A), (B), (C), where wave (C) was an impulse. With this impulse, we change the target in Caterpillar to complete wave X change it from 221.00 – 228.00 to 228.00 – 239.00 area. (If you want to learn more about Elliott Wave Theory, please follow these links: Elliott Wave Education and Elliott Wave Theory).
Caterpillar January 28th 2022 daily chart
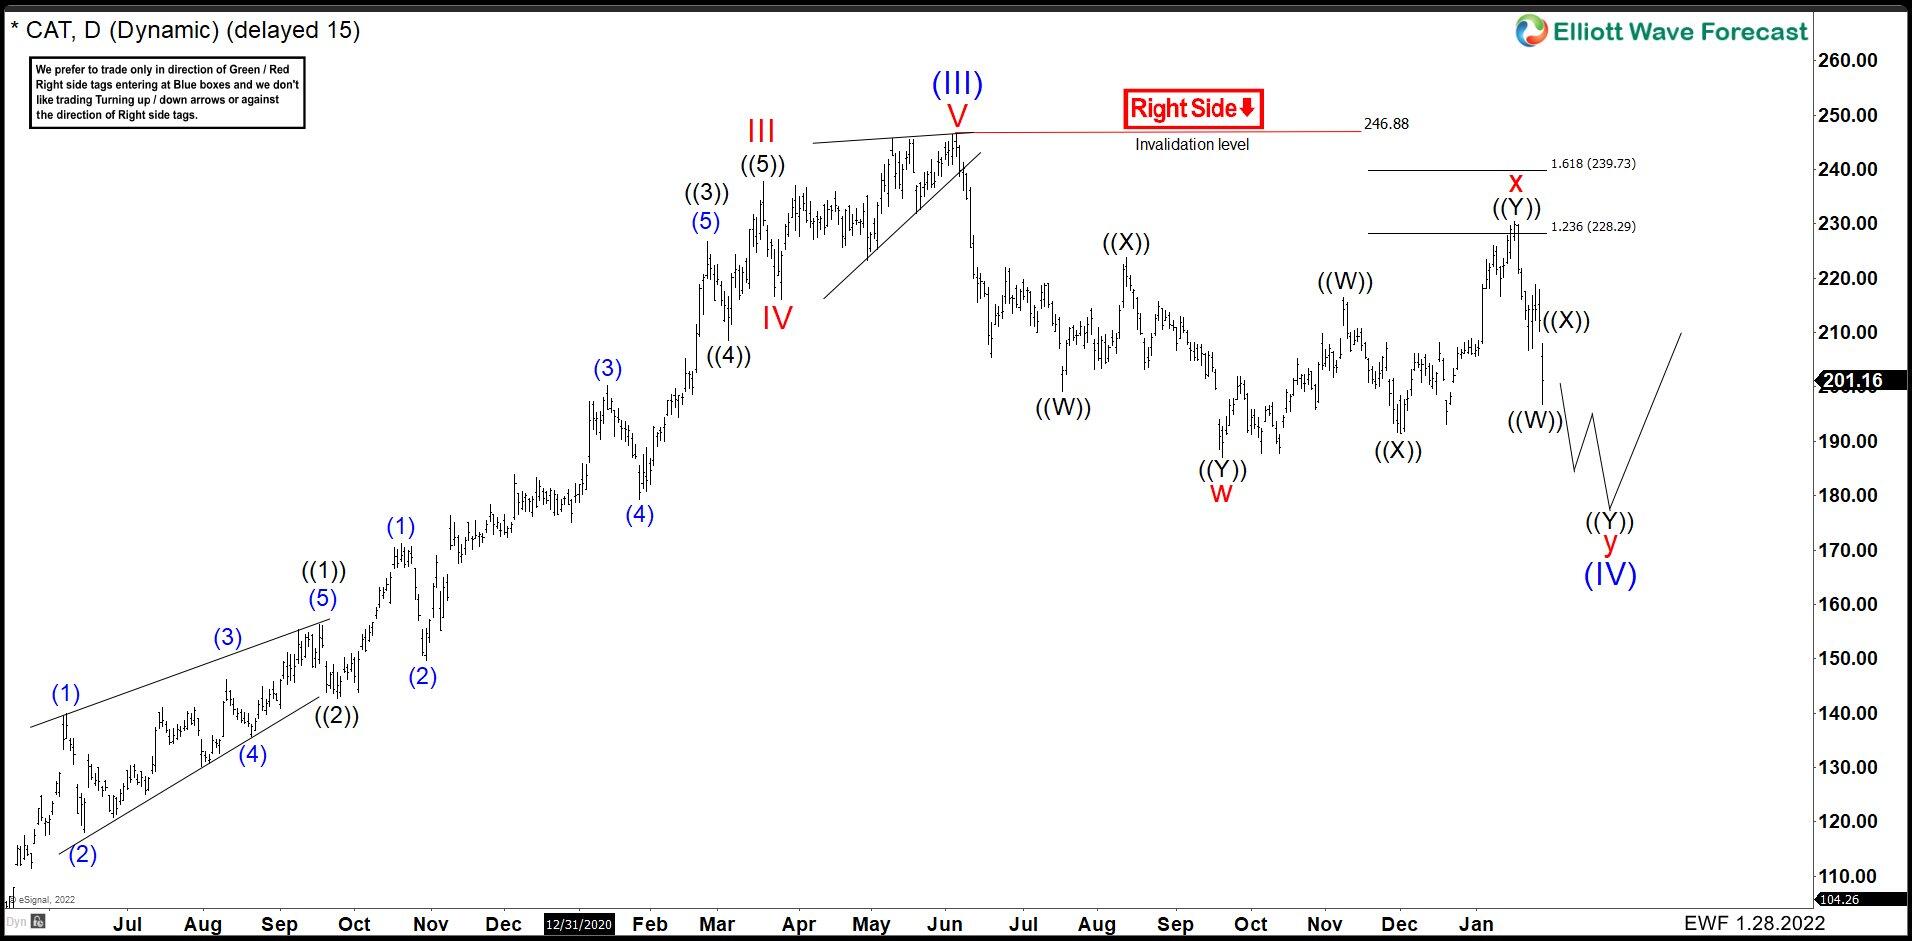
Caterpillar continued higher ending wave ((Y)) and X at 230.96. Then we saw a reaction lower as expected and we should continue lower to break 186.98 and complete wave (IV). The possible area to complete wave (IV) comes in 170.00 – 184.00 and from there we should continue with the rally to complete wave (V).
Premium
You have reached your limit of 3 free articles for this month.
Start your subscription and get access to all our original articles.
Author

Elliott Wave Forecast Team
ElliottWave-Forecast.com


