How high could Conoco Phillips go?

What might a breakout above the 200-day moving average and the 38.2% retracement encourage bulls to do?
Confirming the breakout
What combination of technical factors encouraged the buyers to take action? What did the bulls' northward march leave behind on the chart? How high can the price soar in the coming week? If these (or similar) questions have been on your mind, I invite you to read today's article, in which I provide answers to all these questions. Have a nice read.
Let’s start today's analysis with the quote from the last commentary on Conoco Phillips posted on Jan.17:
(…) What’s next?
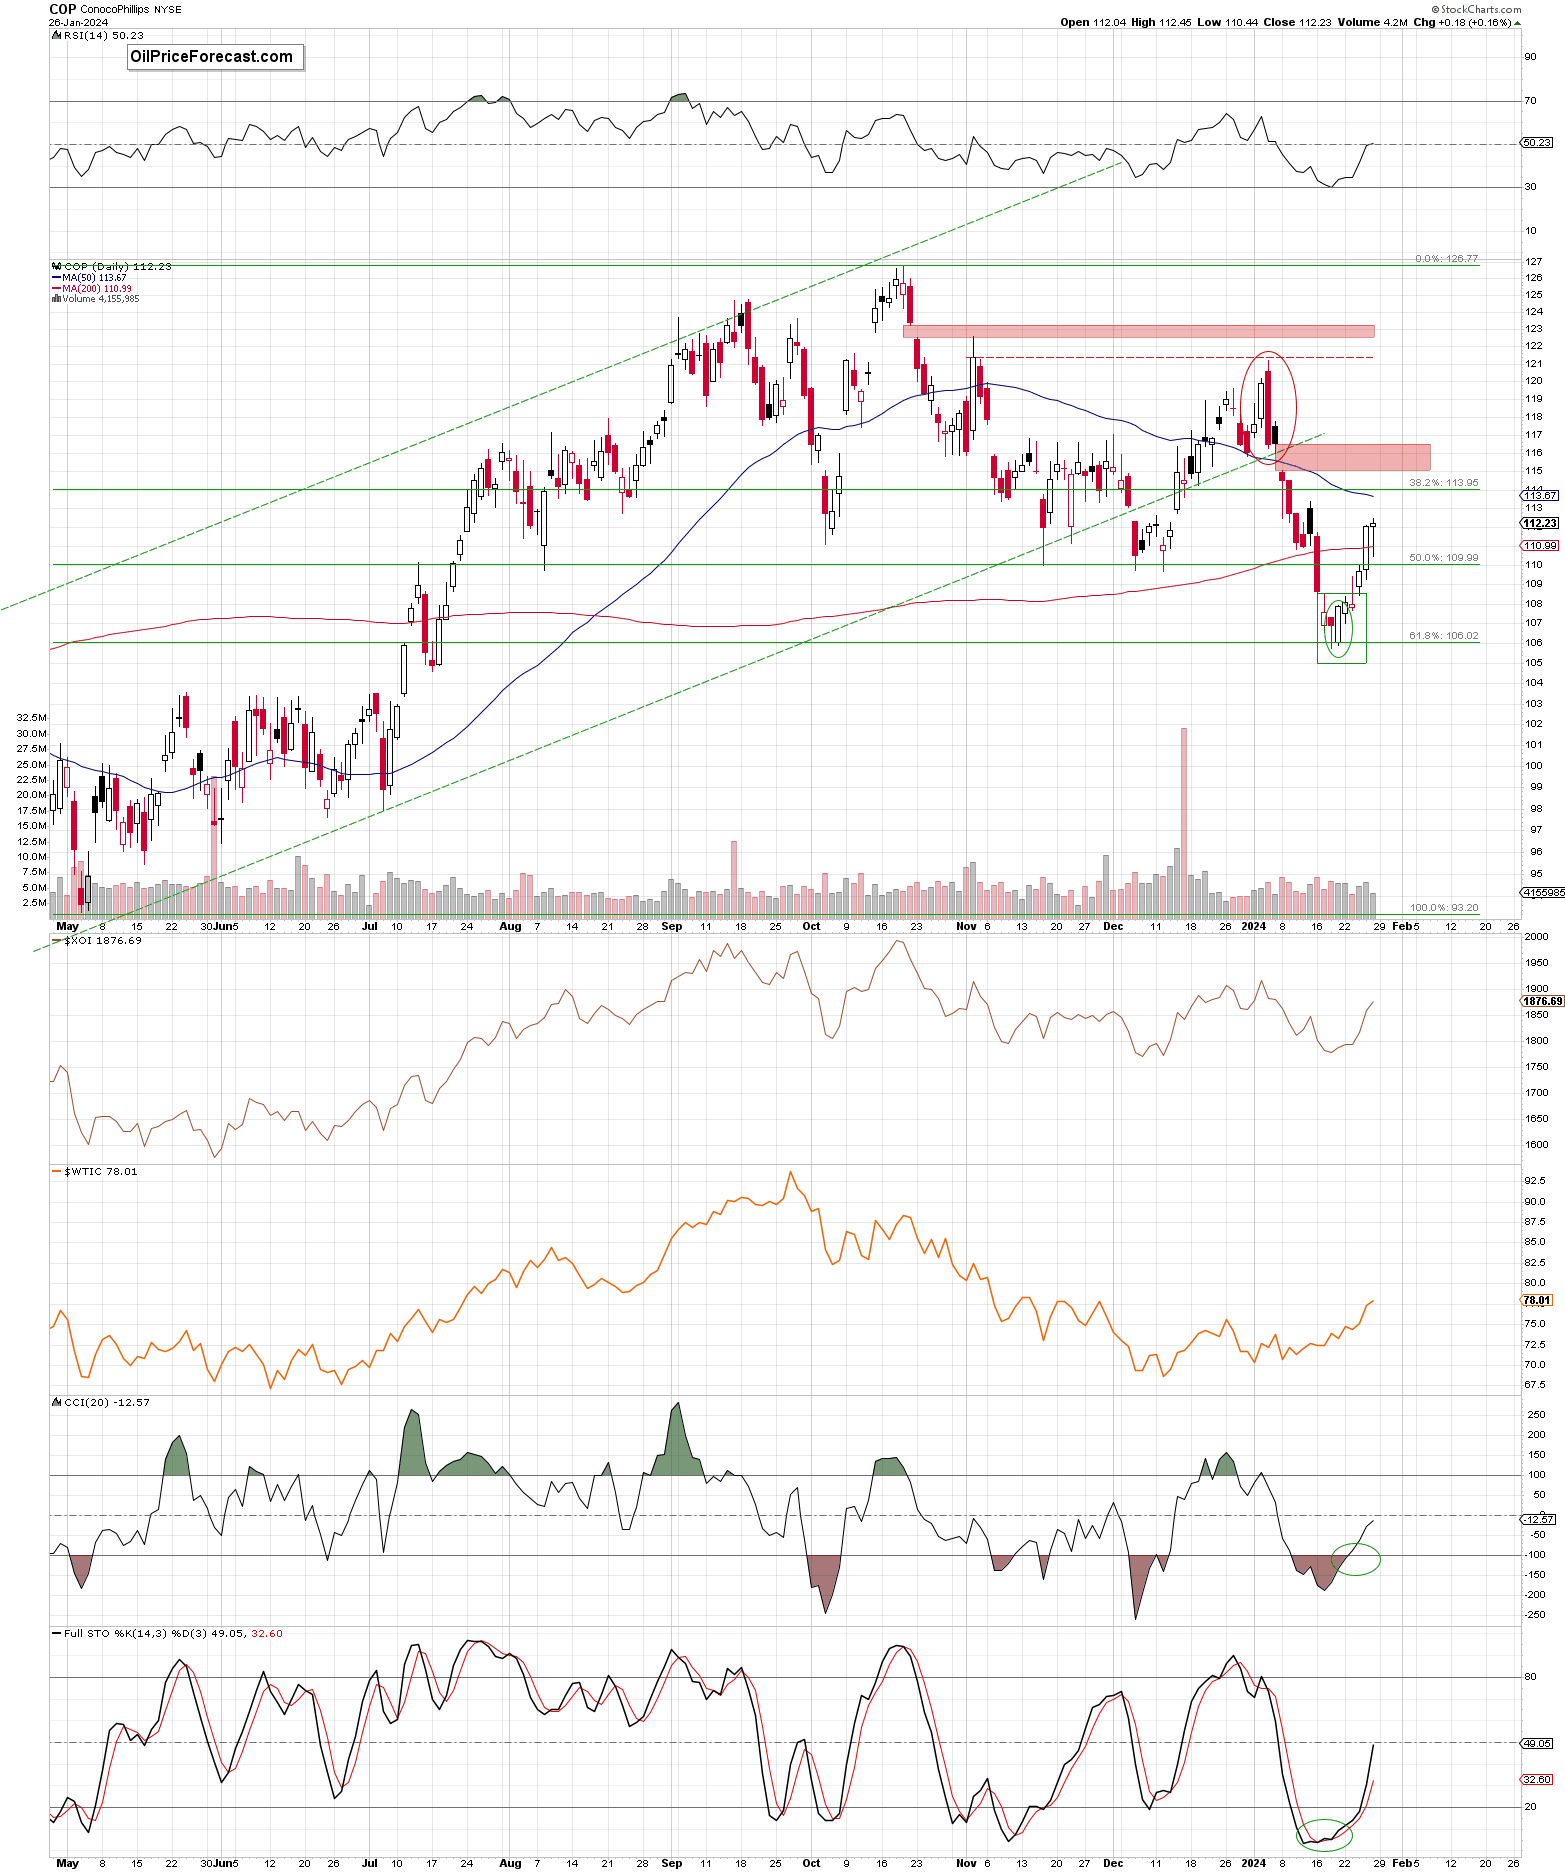
(…) the recent downward move took the price to the next support area based on another green gap (107.92-108.92) created on Jul.20, 2023, which seems to be the last stop before a potential test of the 61.8% Fibonacci retracement based on the entire May-October upward move.
Will it withstand the selling pressure?
(…) the CCI and the Stochastic Oscillator dropped to their oversold areas, which suggests that we could see buy signals in the coming days, but, in my opinion, it’s not enough to stop the sellers – especially when we factor in increased volume during yesterday’s session, a breakdown under the 200-day moving average and the breakdown under green solid support zone based on the previous lows and the 50% Fibonacci retracement, which support pro-declining scenario (…) in the coming day(s).
From today’s point of view, we see that the sellers attacked after the article quoted above was posted, which actually resulted in a closure of the green gap and a decline to the mentioned downside target in the following days.
Thanks to this price action, the bears tested the 61.8% Fibonacci retracement (based on the entire May-October upward move) but failed to close the day below this important support, which resulted in a pro-growth hammer candle (on Jan. 18) and then a bullish engulfing pattern on the following day.
This positive development (especially if we take into account the fact that both patterns were built on strong support), in combination with buy signals generated by the indicator, triggered further improvement, which left one more pro-growth candlestick formation on the chart – the island reversal (marked with the green rectangle on the above chart).
This combination of favorable technical factors lured even more buyers to the trading floor, who managed to push the price above not only above the previously broken 50% Fibonacci retracement but also above the 200-day moving average in the following days.
During Friday’s session, the price verified this breakout above the moving average, which suggests further improvement in the coming week.
How high could stocks go?
Let’s take a look at the chart below to find out.
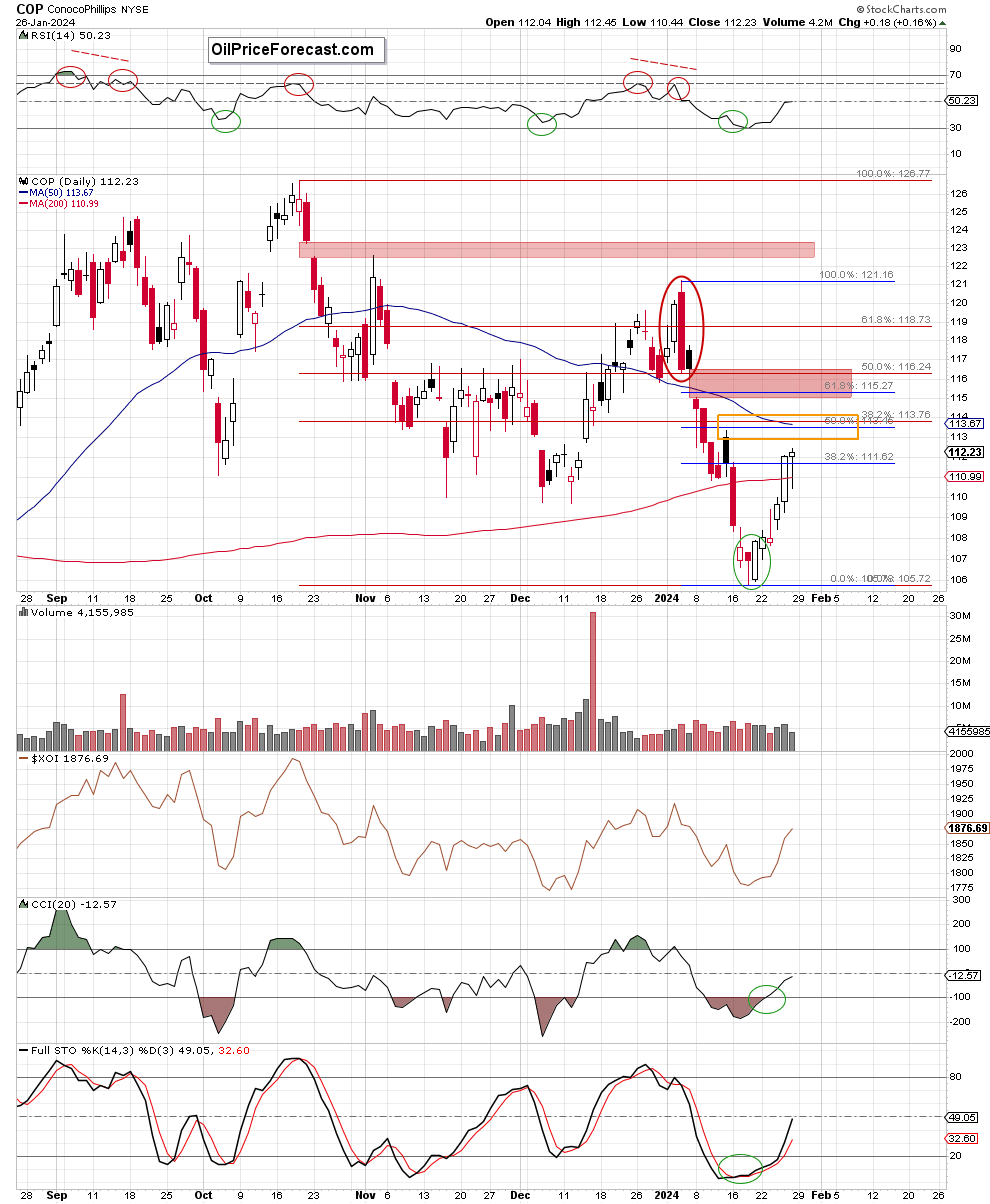
From this perspective, we see that recent price action took stocks above the 38.2% Fibonacci retracement (based on the entire Jan.4-Jan.18 downward move), which, together with buy signals (generated previously by the daily indicators) suggests that we’ll likely see a test of the next resistance area (created by the 50% Fibonacci retracement, the Jan. 12 peak and the 50-day moving average) in the coming week.
If it is broken, the next target for the buyers would be the red gap (114.96-116.53) created on Jan.8, which is currently reinforced by the 61.8% Fibonacci retracement.
Nevertheless, please keep in mind that Friday’s move materialized in a smaller volume than previous white candles, which suggests that it is worth carefully monitoring the strength of the bulls during the coming sessions, as any signs of weakness may be exploited by their opponents and thwart their pro-growth plans.
Before summarizing this section, let’s check how the discussed price action affected the medium-term picture.
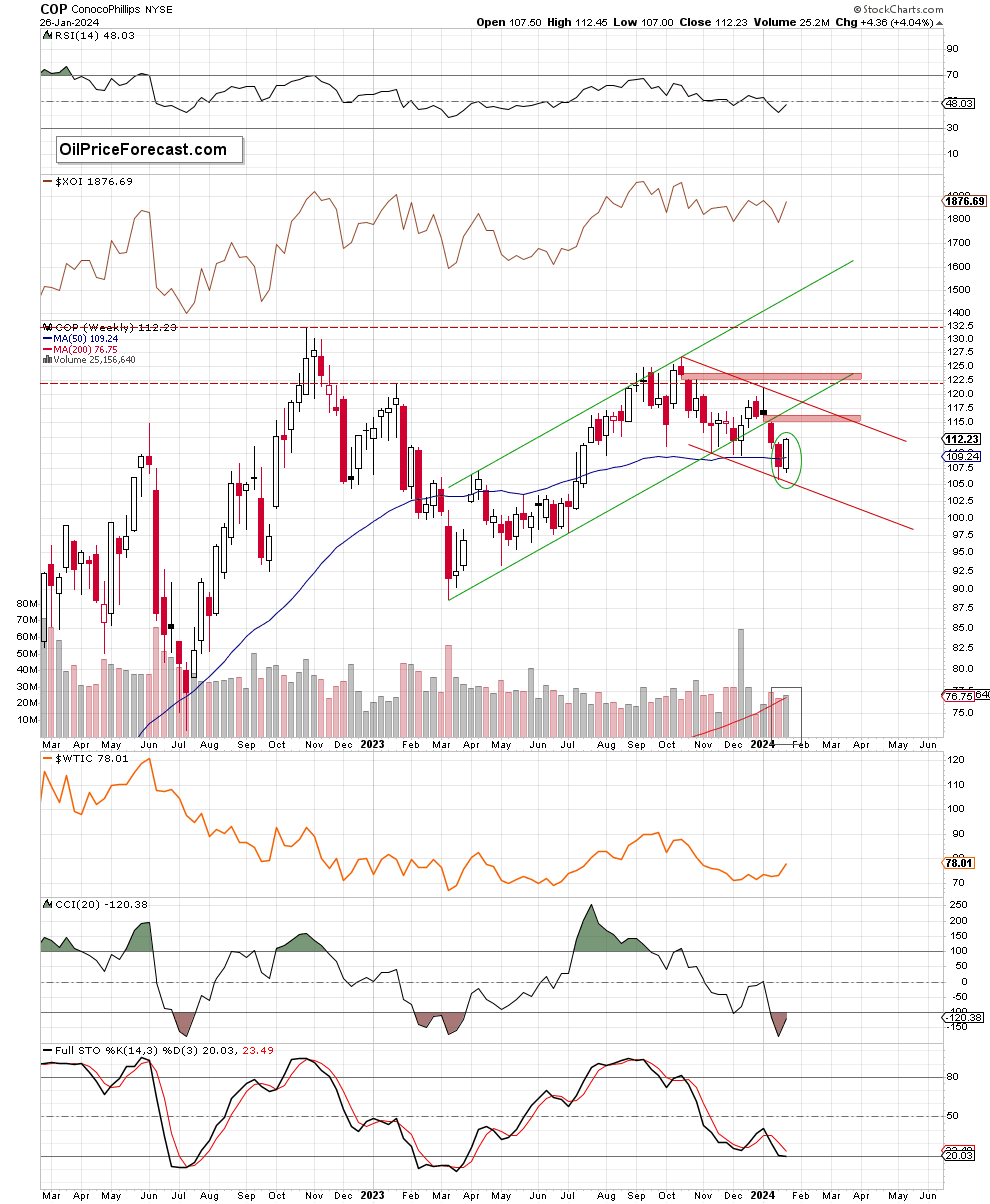
Looking at the weekly chart, we see that the recent downward move took stocks not only to the mentioned 61.8% Fibonacci retracement but also to the lower border of the red declining trend channel.
Despite a drop below the 50-week moving average, this important support line, in combination with the 61.8% Fibonacci retracement, stopped the sellers, triggering a rebound. Additionally, thanks to the last week’s increase, the bulls gained one more ally, which will strengthen this already strong support zone.
What do I mean?
Yes, the bullish engulfing pattern (marked with the green ellipse).
On top of that, last week’s move materialized on higher volume than the previous downswing, which confirms the bulls’ involvement and increases the likelihood of further improvement in the coming week.
Summing up, the combination of strong supports (the lower border of the red declining trend channel [seen on the weekly chart], the 61.8% Fibonacci retracement, three pro-growth formations seen on the daily chart and a bullish engulfing pattern marked on the weekly chart) and buy signals generated by the daily indicators pushed the buyers to fight. Thanks to their action, the price increased above the 38.2% Fibonacci retracement (based on the entire Jan. decline), opening the way to the next resistance area, which test we may witness this week.
Want free follow-ups to the above article and details not available to 99%+ investors? Sign up to our free newsletter today!
Premium
You have reached your limit of 3 free articles for this month.
Start your subscription and get access to all our original articles.
Author

Anna Radomska
Gold Price Forecast
Anna's passion for drawing evolved into a fascination with colorful lines and shapes, which later inspired her interest in the stock market.


