Home Depot reacted from the blue box looking for more downside
Home Depot (HD), is an American multinational home improvement retail corporation that sells tools, construction products, appliances, and services, including fuel and transportation rentals. Home Depot is the largest home improvement retailer in the United States.
After reaching all-time highs in December 2021, the price of HD fell considerably. According to the Elliott Wave Principle, the stock price should continue to fall after to end wave (b) pullback. Wave (b) entered in a double or a flat correction and we are going to talk about next. (If you want to learn more about Elliott Wave Theory, please follow these links: Elliott Wave Education and Elliott Wave Theory).
Home Depot HD monthly chart January 2024
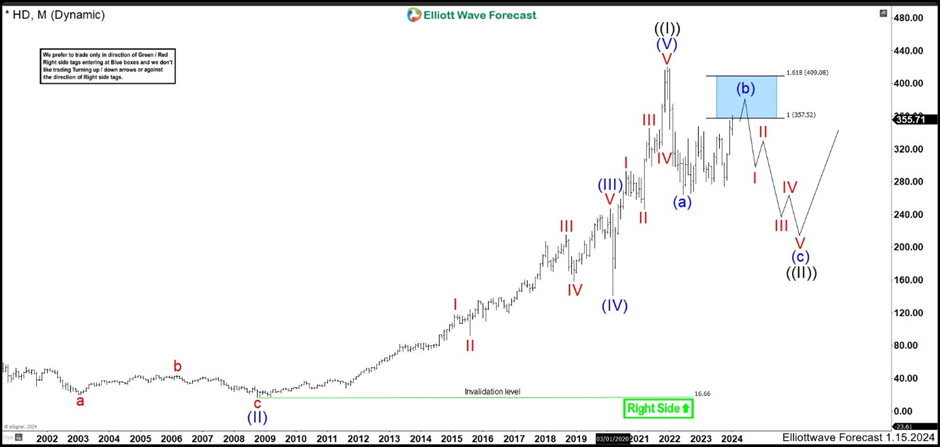
Since December 2021 high, the price of HD has remained bearish and to complete a corrective structure it should continue with more decline. This is because, to finish a corrective structure is required a minimum of 3 waves where the third wave must break the end of the first wave at least marginally. Suggesting further drops in HD price in wave (c). Last time after ending wave (a) lower, we called more upside to end wave (b) correction because it enters in a incomplete bullish sequence. Wave (b) needed to end a new structure before resuming to the downside from 357.52 – 409.08 blue box area.
Home Depot HD monthly chart May 2024

After 4 months, HD entered to the blue box area and in March 21 the stock ended wave (b) at 396.87 high. The market had a strong reaction lower from the blue box and wave I lower was completed at 326.90 in April 25. As we see in the chart, we still need more downside to complete an impulse as wave (c) and the whole correction as wave ((II)). Once the correction is finished, the stock should continue to the upside.
Home Depot HD Daily chart January 2024
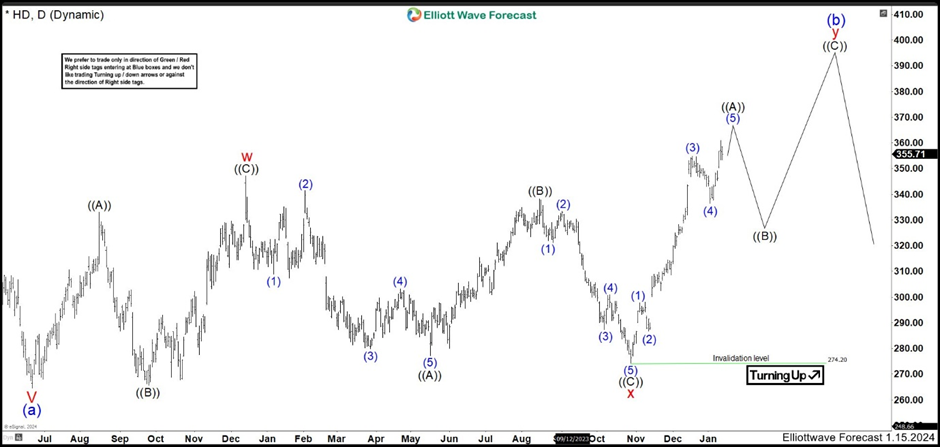
In Daily chart, we watched closer what was happening with HD price. As 347.25 high was broken, the stock entered in a double correction structure. From wave (a) low, market made 3 swings higher ending wave “w” at 347.25 high. Then, we had 3 swings lower as a zig zag correction to end wave “x” at 274.20 low. As price action stays above 274.20 low, we expected to see 3 swings more to the upside to finish wave “y” of ((b)) before turning lower in wave (c).
Home Depot HD daily chart May 2024
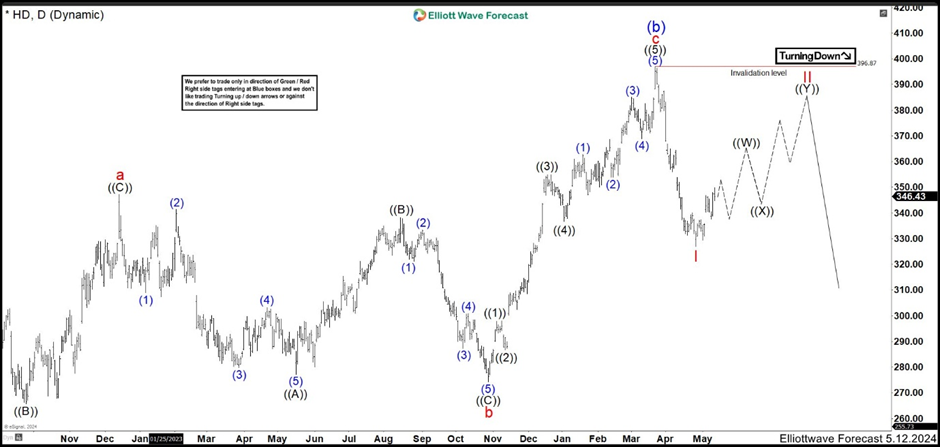
As we can see in the chart, last time we called a double correction structure wxy as wave (b). However, the rally from wave b low was an impulse structure. Therefore, the wave (b) correction was just a flat correction abc with a 3-3-5 structure. We saw a nice rejection lower from wave (b) high ending wave I at 326.90 low. Curretly, we are expecting a double correction higher as wave II before resuming to the downside. The view is valid as price action stays below 396.87 high.
Author

Elliott Wave Forecast Team
ElliottWave-Forecast.com


