HE #F: Lean Hogs reacting higher from blue box area

Lean Hogs is a livestock commodity within the agriculture asset class, along with live cattle, feeder cattle and pork cutouts. One can trade Lean Hogs futures at Chicago Mercantile Exchange in contracts of 40’000 pounds each under the ticker HE #F. As a matter of fact, the futures prices are widely used by U.S. pork producers as a reference for selling their hogs. Therefore, anticipation of the HE #F price development is of a high impact on the modern society. Indeed, the price action of the lean hogs futures reflects the future steak price on the barbecue.
Currently, we see a buying opportunity in commodities after a long period of depressed prices. Also, lean hogs are expected to be in a new bullish cycle. In the previous article from September 2022, we have explained the bullish sequence from April 2020 and the next buying opportunity. As a matter of fact, the price reached into 83.69-71.27 buying range. From there, a bounce is currently taking place. In this blog, we provide an update while discussing the wave structure, the price action and the targets of the new bullish cycle of the lean hogs futures.
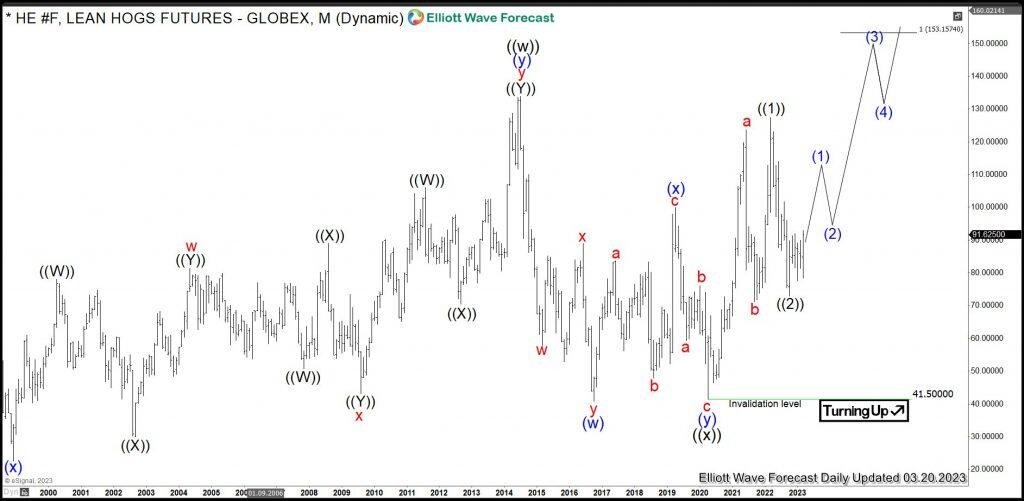
Lean Hogs monthly Elliott Wave analysis 03.21.2023
The monthly chart below shows the lean hogs front contract HE #F. Firstly, from the start of trading back in 1966, the prices have developed a cycle higher in black wave ((w)) of a grand super cycle degree. It has printed the all-time highs in July 2014 at 133.80. Then, from the highs, a correction lower in wave ((x)) has unfolded as an Elliott Wave double three pattern. In almost six years, HE #F have become cheaper by almost 70% reaching 41.50 price level. It is the preferred view that an important bottom on April 2020 has been set and the black wave ((x)) has ended. From the lows, the recovery in prices may have started.
For 2023-2030, the expectations are to break out to the new all-time highs. The target for wave ((y)) to end will be 175-258 area.
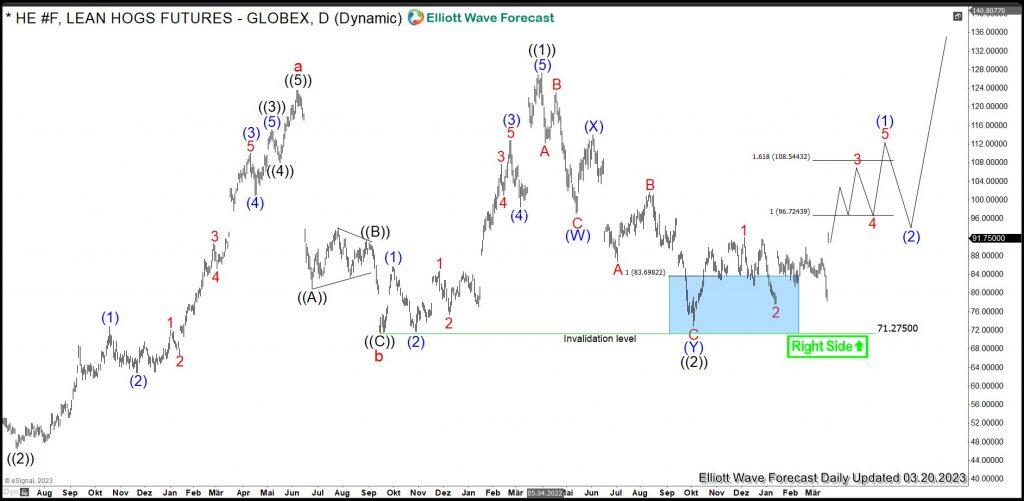
Lean Hogs daily Elliott Wave analysis 03.21.2023
The daily chart below shows in more detail the advance from the April 2020 lows. Firstly, from the bottom at 41.50, red waves a and b have ended. Hereby, wave a is a textbook quality impulse. Obviously, black wave ((3)) of red wave a shows an extension. Then, from the lows of September 2021 at 71.275, wave c has started. It has been confirmed by breaking above the peak of red wave a at 123.60 opening up a bullish sequence. Now, we expect wave c of an Elliott wave zigzag in blue wave (w) to reach higher towards 153-204 area.
In shorter cycles, waves ((1))-((2)) have ended. Hereby, double three structure in black wave ((2)) has reached 83.69-71.27 area. The reaction out of the blue box is taking place. Hereby, traders can be looking for next short term targets towards 96.72-108.54 area. Investors should stay long targeting 153-204 area medium-term and 175-258 area in a long run.
Author

Elliott Wave Forecast Team
ElliottWave-Forecast.com