Hang Seng index Elliott Wave technical analysis [Video]
![Hang Seng index Elliott Wave technical analysis [Video]](https://editorial.fxsstatic.com/images/i/windows-01_XtraLarge.jpg)
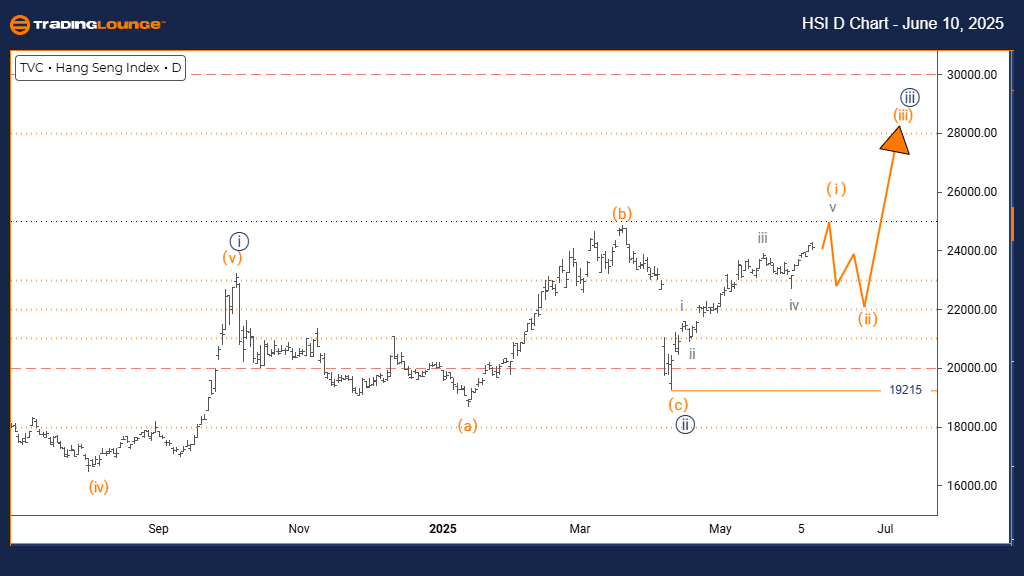
Hang Seng Index Wave technical analysis
Function: Trend.
Mode: Impulsive.
Structure: Orange Wave 1.
Position: Navy Blue Wave 3.
Direction next lower degrees: Orange Wave 2.
Details: Navy Blue Wave 2 appears complete; Orange Wave 1 of 3 is now in play.
Wave cancellation Invalidation Level: 19215.
The Hang Seng Index daily Elliott Wave analysis suggests a bullish trend supported by impulsive price action, indicating strong upward momentum. The current wave structure identifies Orange Wave 1, which is part of Navy Blue Wave 3. This wave formation suggests the index is beginning a significant upward leg within a larger bullish cycle.
The analysis confirms that Navy Blue Wave 2 has likely concluded its corrective phase, marking the transition into Orange Wave 1 of Navy Blue Wave 3. This shift is indicative of the early stages of a powerful bullish advance. The expected next development at lower degrees is Orange Wave 2, which typically follows the initial impulse and acts as a corrective pullback before the continuation of the trend.
A key level to monitor is the invalidation threshold at 19215. A break below this level would negate the current bullish wave interpretation and require a reassessment. Until then, the outlook supports continued upward movement.
This technical setup positions the Hang Seng Index for further gains, with Orange Wave 1 active following the completion of Navy Blue Wave 2. The impulsive nature of this trend phase suggests robust buying pressure, pointing to more potential upside in the coming sessions.
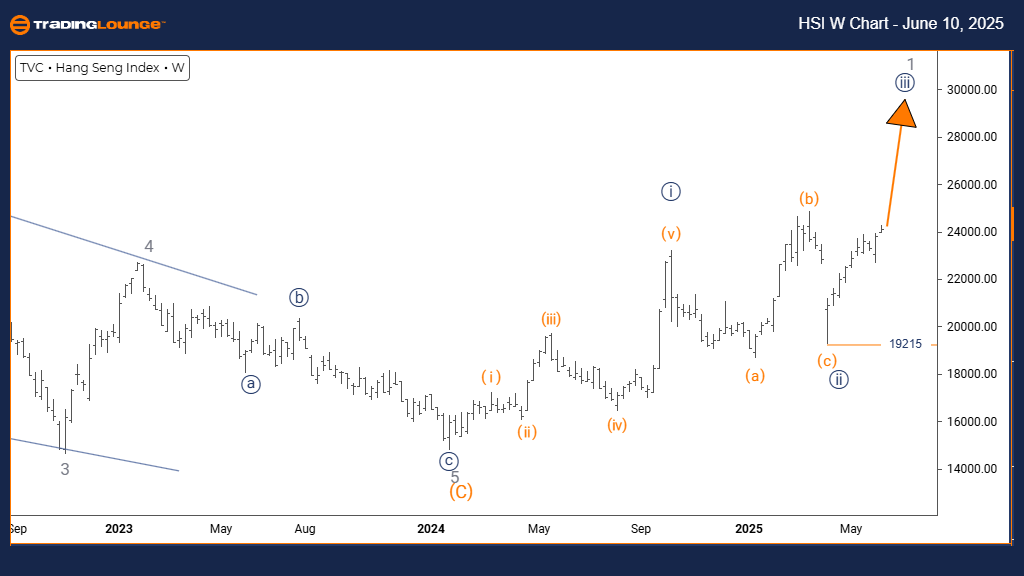
Hang Seng Index Wave technical analysis
Function: Trend.
Mode: Impulsive.
Structure: Navy Blue Wave 3.
Position: Gray Wave 1.
Direction next lower degrees: Navy Blue Wave.
Details: Navy Blue Wave 2 appears complete; Navy Blue Wave 3 is now active.
Wave cancellation invalidation level: 19215.
The weekly Elliott Wave analysis of the Hang Seng Index confirms a bullish trend, with the current price action being impulsive. The index is developing Navy Blue Wave 3, which is part of a larger Gray Wave 1 sequence. This wave phase is considered one of the strongest in the Elliott Wave cycle, often accompanied by significant price increases.
Following the completion of Navy Blue Wave 2, the transition into Navy Blue Wave 3 indicates the start of a robust advance. This wave typically represents the most dynamic phase of an impulsive sequence, providing notable upward movement. The anticipated next movements will occur within the internal structure of Navy Blue Wave 3.
The invalidation level remains at 19215. A drop below this level would nullify the current wave count and suggest the need for reevaluation. Otherwise, the bullish structure remains intact and supports continued upward movement.
Overall, this analysis places the Hang Seng Index in a strong position to maintain upward momentum, with Navy Blue Wave 3 actively developing. Investors should monitor the 19215 level closely for confirmation of the wave structure while preparing for potential growth within the Gray Wave 1 framework.
Hang Seng Index Wave technical analysis [Video]
Author

Peter Mathers
TradingLounge
Peter Mathers started actively trading in 1982. He began his career at Hoei and Shoin, a Japanese futures trading company.


