|

Google stock (GOOGL) approaches historic peak, $336 in sight [Video]

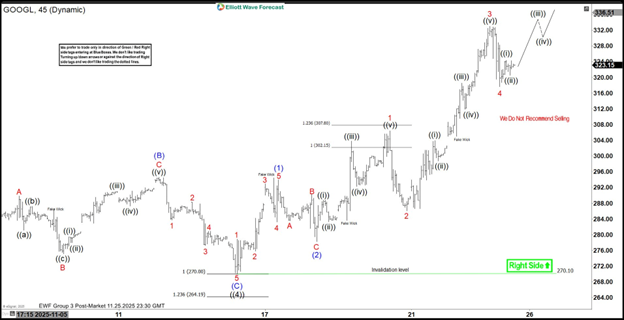
The short-term Elliott Wave view in Google (GOOGL) indicates that the stock is progressing within the final wave ((5)) of the impulsive rally that began from the April 2025 low. Wave ((4)) of this sequence concluded at $270.1, as reflected in the 45-minute chart. Following that completion, the stock resumed its advance toward new all-time highs, unfolding wave ((5)) as a five-wave impulse of lesser degree. From the termination of wave ((4)), wave (1) reached $293.95, while the corrective pullback in wave (2) settled at $278.2. The structure then nested higher into wave (3), reinforcing the bullish momentum.

From wave (2), wave 1 advanced to $306.42, followed by a modest dip in wave 2 that ended at $286.05. The third wave extended strongly, culminating at $332.98, before a corrective decline in wave 4 brought prices down to $317.65. The expectation now is for the stock to extend higher once more, completing wave 5 and thereby finalizing wave (3) of the larger degree. Afterward, a corrective phase in wave (4) should emerge, setting the stage for another rally in wave (5). This final advance would complete wave ((5)) and the broader cycle from the April 2025 low.

In the near term, as long as the pivotal support at $270.1 remains intact, dips are anticipated to find support within the typical three, seven, or eleven swing corrective structures. This suggests that the broader outlook continues to favor further upside, with each corrective phase offering opportunities for continuation of the bullish trend.

Google (GOOGL) 45-minute Elliott Wave chart from 11.25.2025

Chart

GOOGL Elliott Wave [Video]

Youtube preview

Author

Elliott Wave Forecast Team

Elliott Wave Forecast Team

ElliottWave-Forecast.com

More from Elliott Wave Forecast Team
Share:

Editor's Picks

EUR/USD stays well offered below 1.1800

The selling pressure on EUR/USD is picking up pace, with the pair slipping decisively below the key 1.1800 level and sliding to fresh two week lows as Wednesday’s session draws to a close. The move lower comes as the US Dollar finds renewed strength after the latest round of US data and the release of the FOMC Minutes. Next of note on the docket will be the US weekly Initial Jobless Claims.
 

GBP/USD reaches multi-day lows near 1.3500

GBP/USD reverses its initial upside momentum and is now adding to previous declines, approaching the 1.3500 region on Wednesday. Cable’s downtick comes on the back of decent gains in the Greenback and easing UK inflation figures, which seem to have reinforced the case for a BoE rate cut in March.

Gold battle to regain $5,000 continues

Gold is back on the front foot on Wednesday, shaking off part of the early week softness and challenging two-day highs near the $5,000 mark per troy ounce. The move comes ahead of the FOMC Minutes and is unfolding despite an intense rebound in the US Dollar.

Bitcoin has found or is near a bottom, extended consolidation to follow: K33

Bitcoin (BTC) is nearing or has already established a bottom, which could be followed by a sustained period of slow price movement, according to K33.

Mixed UK inflation data no gamechanger for the Bank of England

Food inflation plunged in January, but service sector price pressure is proving stickier. We continue to expect Bank of England rate cuts in March and June. The latest UK inflation read is a mixed bag for the Bank of England, but we doubt it drastically changes the odds of a March rate cut.

Sui extends sideways action ahead of Grayscale’s GSUI ETF launch

Sui is extending its downtrend for the second consecutive day, trading at 0.95 at the time of writing on Wednesday. The Layer-1 token is down over 16% in February and approximately 34% from the start of the year, aligning with the overall bearish sentiment across the crypto market.