Goodman Group Elliott Wave technical forecast [Video]
![Goodman Group Elliott Wave technical forecast [Video]](https://editorial.fxstreet.com/images/TechnicalAnalysis/ChartPatterns/Candlesticks/foreign-exchange-market-chart-24347573_XtraLarge.jpg)
ASX: GMG Elliott Wave technical analysis
Greetings, Our Elliott Wave analysis today updates the Australian Stock Exchange (ASX) GOODMAN GROUP – GMG. We see ASX:GMG pushing lower with wave (iv)-orange, and potential for a subsequent push higher with wave (v)-orange. The analysis also includes important Key points, where to visually indicate when a Bullish trend starts, or a Bearish trend is invalidated.
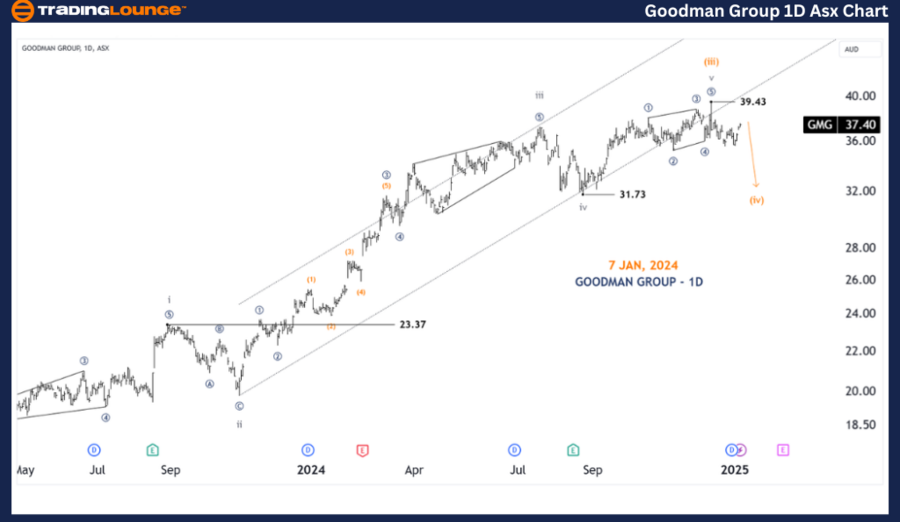
ASX: GMG one-day chart (semilog scale) analysis
Function: Major trend (Subminuette degree, grey).
Mode: Motive.
Structure: Impulse.
Position: Wave (iv)-orange.
Details: Wave (iii)-orange may have ended, and wave (iv)-orange may be unfolding to push lower, targeting around 31.73. A push above 39.43 would call for a reassessment of the entire situation from a bearish perspective.
Invalidation point: The end of Wave (iii)-orange.
Key point: 39.43.
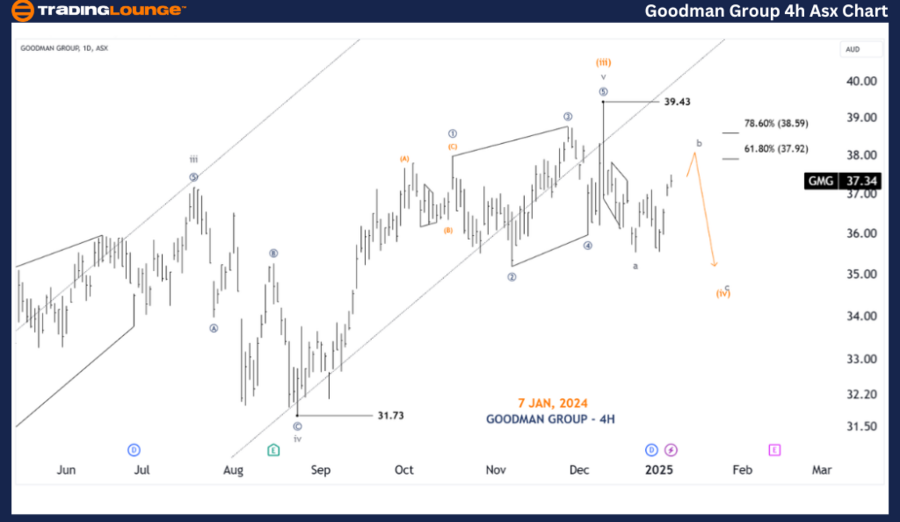
ASX: GMG four-hour chart analysis
Function: Major trend (Subminuette degree, grey).
Mode: Motive.
Structure: Impulse.
Position: Wave b-rey of Wave (iv)-orange.
Details: Nothing has changed when compared to the 1D chart, wave (iv)-orange is pushing further down. The b-grey wave is moving a little higher, and perhaps then the c-grey wave will push down to complete the full role of the (iv)-orange wave.
Invalidation point: 39.43.
Conclusion
Our analysis, forecast of contextual trends, and short-term outlook for ASX: GOODMAN GROUP – GMG aim to provide readers with insights into the current market trends and how to capitalize on them effectively. We offer specific price points that act as validation or invalidation signals for our wave count, enhancing the confidence in our perspective. By combining these factors, we strive to offer readers the most objective and professional perspective on market trends.
Goodman Group Elliott Wave technical forecast [Video]
Author

Peter Mathers
TradingLounge
Peter Mathers started actively trading in 1982. He began his career at Hoei and Shoin, a Japanese futures trading company.


