Gold threatens to break below major trendline after release of US data
- Gold is threatening to break below a key trendline after the release of US PMI data.
- The data showed the Services and Manufacturing sectors in the US expanded more than expected in May.
- Gold’s short-term trend is bearish but it is pentrating a major trendline.

Gold (XAU/USD) has fallen to the $2,340s on Thursday after the release of US S&P Global Purchasing Manager Index survey data showed a greater-than-expected expansion in both the Services and Manufacturing sectors in May. The data suggests interest rates will have to remain restrictively high in the US for some time before inflation can be brought sustainably down to the Federal Reserve's 2.0% target.
The expectation that interest rates will remain at their current level (or higher) for an extended amount of time was bearish for Gold. As a non-yielding asset, higher interest rates increase the opportunity cost of holding Gold, reducing its attractiveness to investors.
The data comes on the back of the release of the Fed's last meeting Minutes on Wednesday, which revealed policymakers were reluctant to lower interest rates – and even discussed hiking them – due to persistent inflationary pressures.
Gold has fallen sharply from its all-time high on Monday and is currently pentrating a major trendline on Gold price chart which if breached decisively could spell doom for Gold bulls.
Gold price continues bearish reversal after PMI data
Gold weakens on Thursday after the release of strong data from the US, showing its economy is in rude health. US S&P Global Manufacturing PMI came out at 50.9 in May, up from the 50.0 in April and the 50.0 forecast by economists. Services PMI, meanwhile, rose to 54.8 from 51.3 in the previous month and 51.3 forecast. Composite PMI came out at 54.4 in May, up from 51.3 in April – and beating the decline to 51.1 economists had expected.
The higher-than-expected Services PMI data, in particular, will have supported the US Dollar (USD) as the Federal Reserve (Fed) has highlighted Services-sector inflation as a key hotspot in the economy that needs to cool down before it moves to cut interest rates. The maintenance of higher interest rates supports the USD since it attracts higher inflows of foreign capital compared to lower interest rates.
Gold declined sharply after the release of the Federal Open Market Committee (FOMC) meeting Minutes for the April 29-May 1 policy meeting on Wednesday.
The Minutes revealed that although policymakers expected price pressures to ease eventually, they had not fallen quickly enough to warrant a cut in the fed funds rate target range, which would remain at its 5.25% - 5.50% level “at least until September,” according to FXStreet.
The strength of the labor market emerged as a key determining factor for future policy. The Fed’s rate-setters even discussed the possibility of raising interest rates to tackle inflation. This added a more hawkish twist to the proceedings and echoed similar discussions in the Reserve Bank of Australia’s (RBA) meeting Minutes.
The Minutes catalyzed a rally in the US Dollar, which has a negative correlation with Gold.
The next major release for Gold is the US Purchasing Manager Index (PMI) data for May at 13:45 GMT on Thursday. If the data is positive it could have a negative impact on Gold, and vice-versa if it is weaker.
Technical Analysis: Gold pentrates trendline
Gold price (XAU/USD) is pentrating the dark-grey major trendline which reflects the uptrend since February.
Gold is now probably in a short-term downtrend favoring short positions over longs. If it breaks decisively below the trendline it would be an extremely bearish sign and suggest deeper declines to come.
XAU/USD Daily Chart
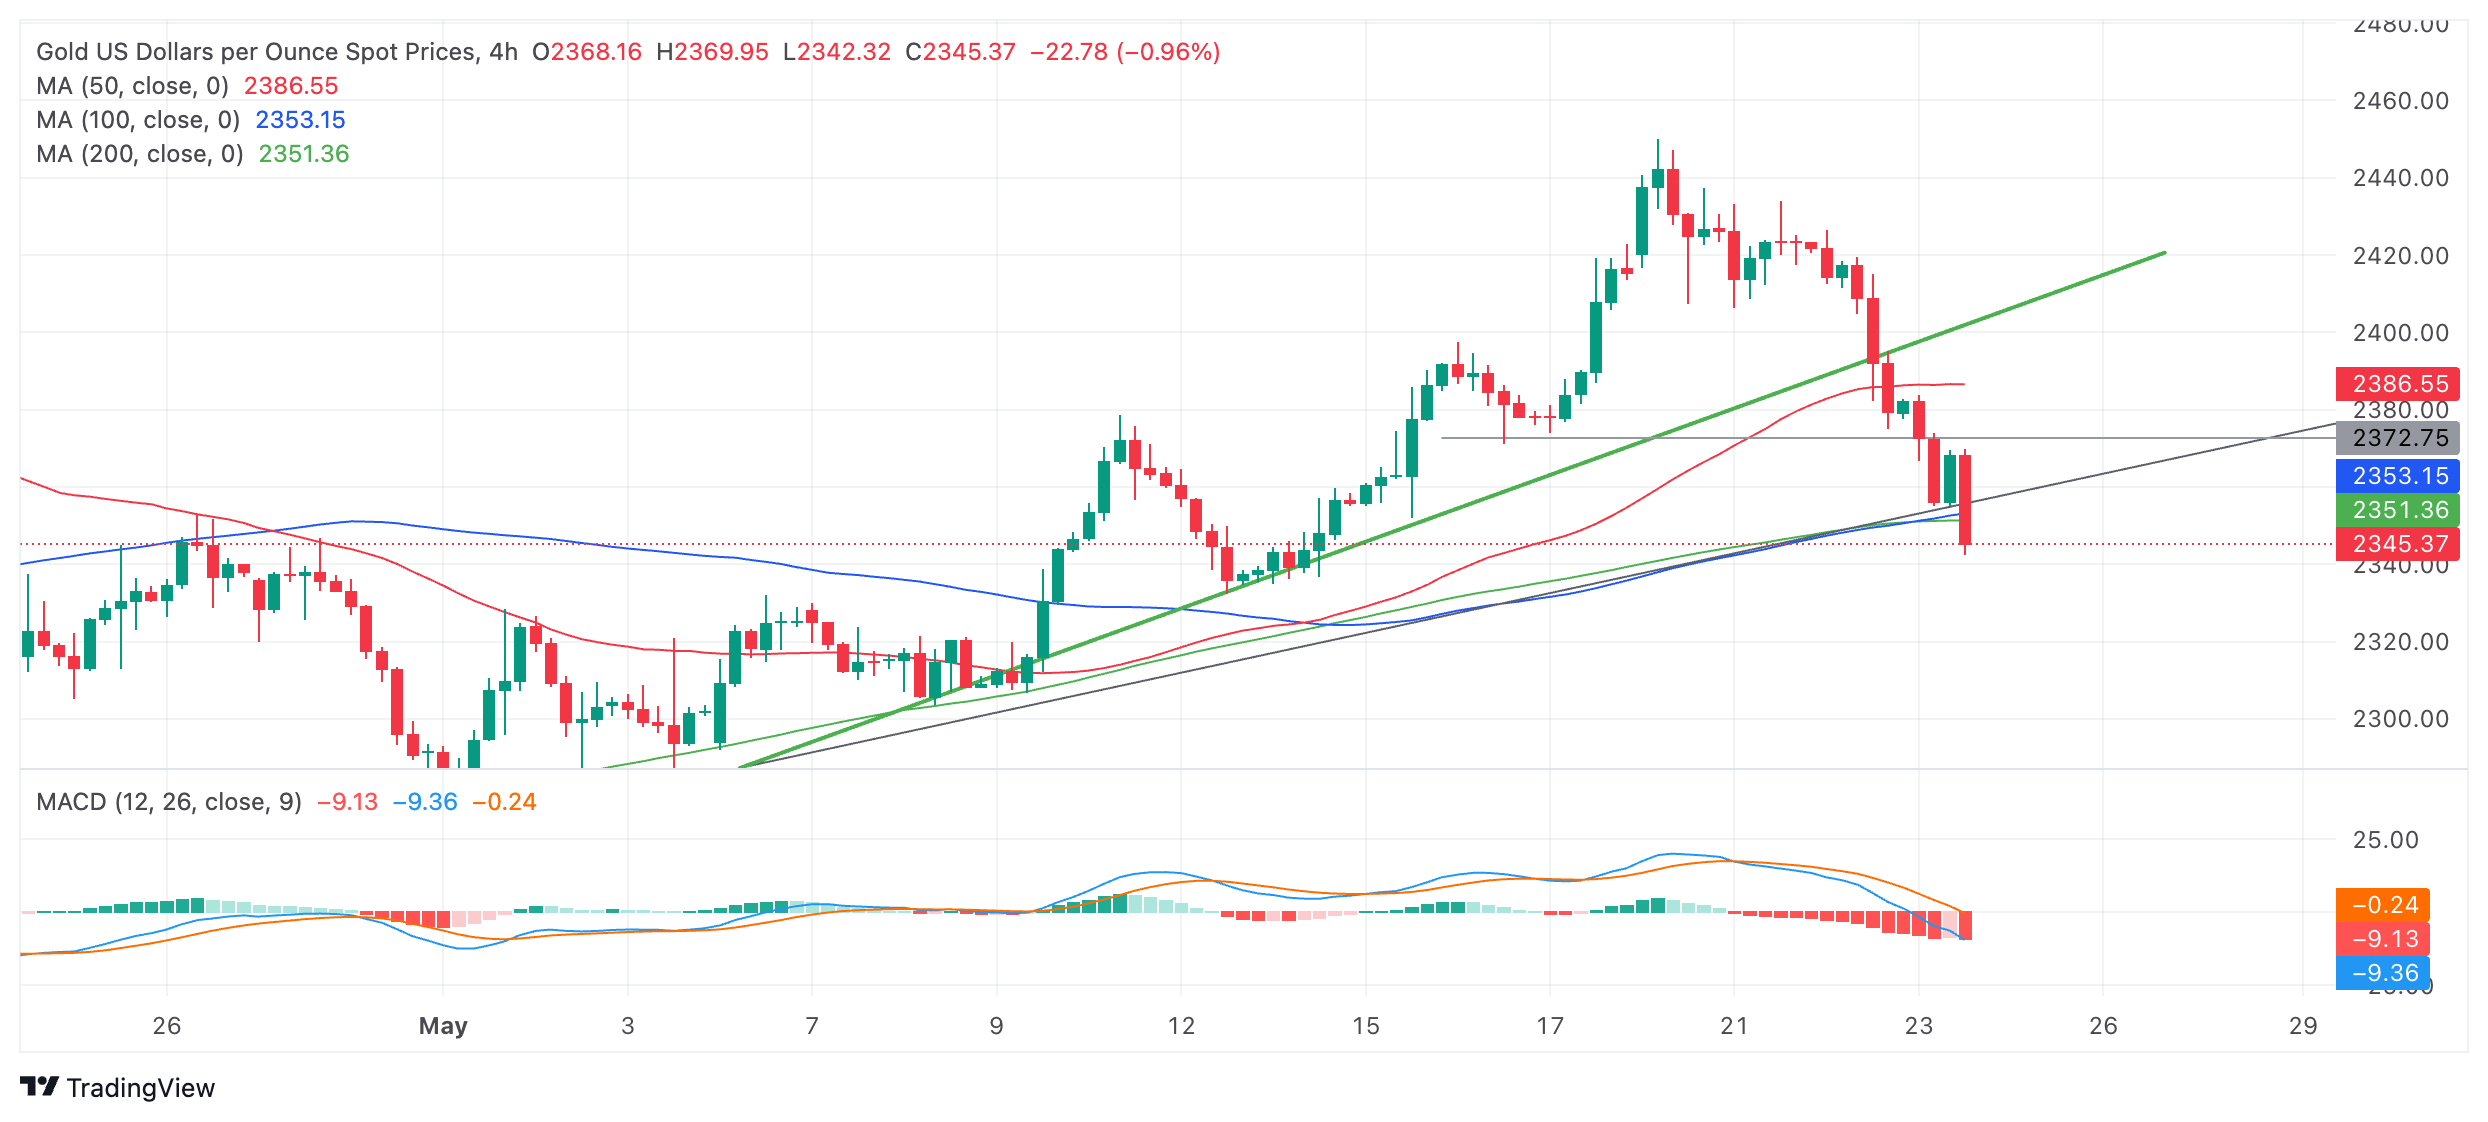
Gold price could fall to a conservative target at $2,305 (Fibonacci 0.618 of the prior down move) or all the way down to $2,275 (100% of the prior down move) in the event bears decisively breach the dark-grey trendline.
A decisive break would be one accompanied by a long red candle that closes near its low or three red candles in a row that break below the trendline.
The precious metal’s medium and long-term trends are still bullish, however, and given the old adage that “the trend is your friend,” this suggests the risk of a recovery remains high. At the moment the only sign a recovery may evolve is that Gold has found support at a major trendline. There are no signs from price action, however, that a reversal is underway.
A break above the new $2,450 all-time high would confirm a continuation of the uptrend and a rally to the next target, probably at the psychologically significant $2,500 level.
Economic Indicator
S&P Global Services PMI
The S&P Global Services Purchasing Managers Index (PMI), released on a monthly basis, is a leading indicator gauging business activity in the US services sector. As the services sector dominates a large part of the economy, the Services PMI is an important indicator gauging the state of overall economic conditions. The data is derived from surveys of senior executives at private-sector companies from the services sector. Survey responses reflect the change, if any, in the current month compared to the previous month and can anticipate changing trends in official data series such as Gross Domestic Product (GDP), industrial production, employment and inflation. A reading above 50 indicates that the services economy is generally expanding, a bullish sign for the US Dollar (USD). Meanwhile, a reading below 50 signals that activity among service providers is generally declining, which is seen as bearish for USD.
Read more.Last release: Thu May 23, 2024 13:45 (Prel)
Frequency: Monthly
Actual: 54.8
Consensus: 51.3
Previous: 51.3
Source: S&P Global
Author

Joaquin Monfort
FXStreet
Joaquin Monfort is a financial writer and analyst with over 10 years experience writing about financial markets and alt data. He holds a degree in Anthropology from London University and a Diploma in Technical analysis.


