Gold tests support at $2,500, USD recovery weighs
- Gold tests the bottom of a mini-range at $2,500.
- The upside is capped by a recovering US Dollar on the back of easing concerns about the US economy.
- Labor market data out this week could be key, with Nonfarm Payrolls the main release on Friday.

Gold (XAU/USD) edges down and tests $2,500 on Monday as the recovery in the US Dollar (USD) over recent days puts pressure on the precious metal. Gold is negatively correlated to USD, in which it is mostly priced and traded.
Gold’s wings clipped by recovery in US Dollar
Gold’s price is facing a little bit of a headwind from the US Dollar (USD) at the start of the new week after the Greenback bounced back from the year-to-date lows that reached last Tuesday when the US Dollar Index (DXY) touched down at 100.52. It is now trading back up in the 101.60s after the release of July’s US Personal Consumption Expenditures (PCE) data on Friday showed inflation unchanged from the previous month. This, in turn, reassured markets that the US economy is probably heading for a “soft” rather than a “hard” landing.
The outlook for US interest rates, another major driver for the precious metal, remains about the same, with the probabilities of a 50 basis point (bps) cut in September still just above 30% and a 25 bps cut fully priced in, according to the CME FedWatch Tool.
Trading conditions will be thin on Monday as both the US and Canada are on holiday due to Labor Day. Employment data out this week – culminating in Nonfarm Payrolls (NFP) on Friday – however, will be a key deciding factor as to whether the Federal Reserve (Fed) will opt for a big half percent cut or a more standard quarter percent reduction.
Technical Analysis: Continues trading in mini-range
Gold (XAU/USD) continues trading within a mini-range between $2,500 and $2,531. The short-term trend could now probably be characterized as “sideways” and, therefore, is more likely than not to continue oscillating until a breakout occurs.
Gold’s medium and long-term trends remain bullish, which, given “the trend is your friend,” means the odds favor an eventual breakout higher materializing.
XAU/USD 4-hour Chart
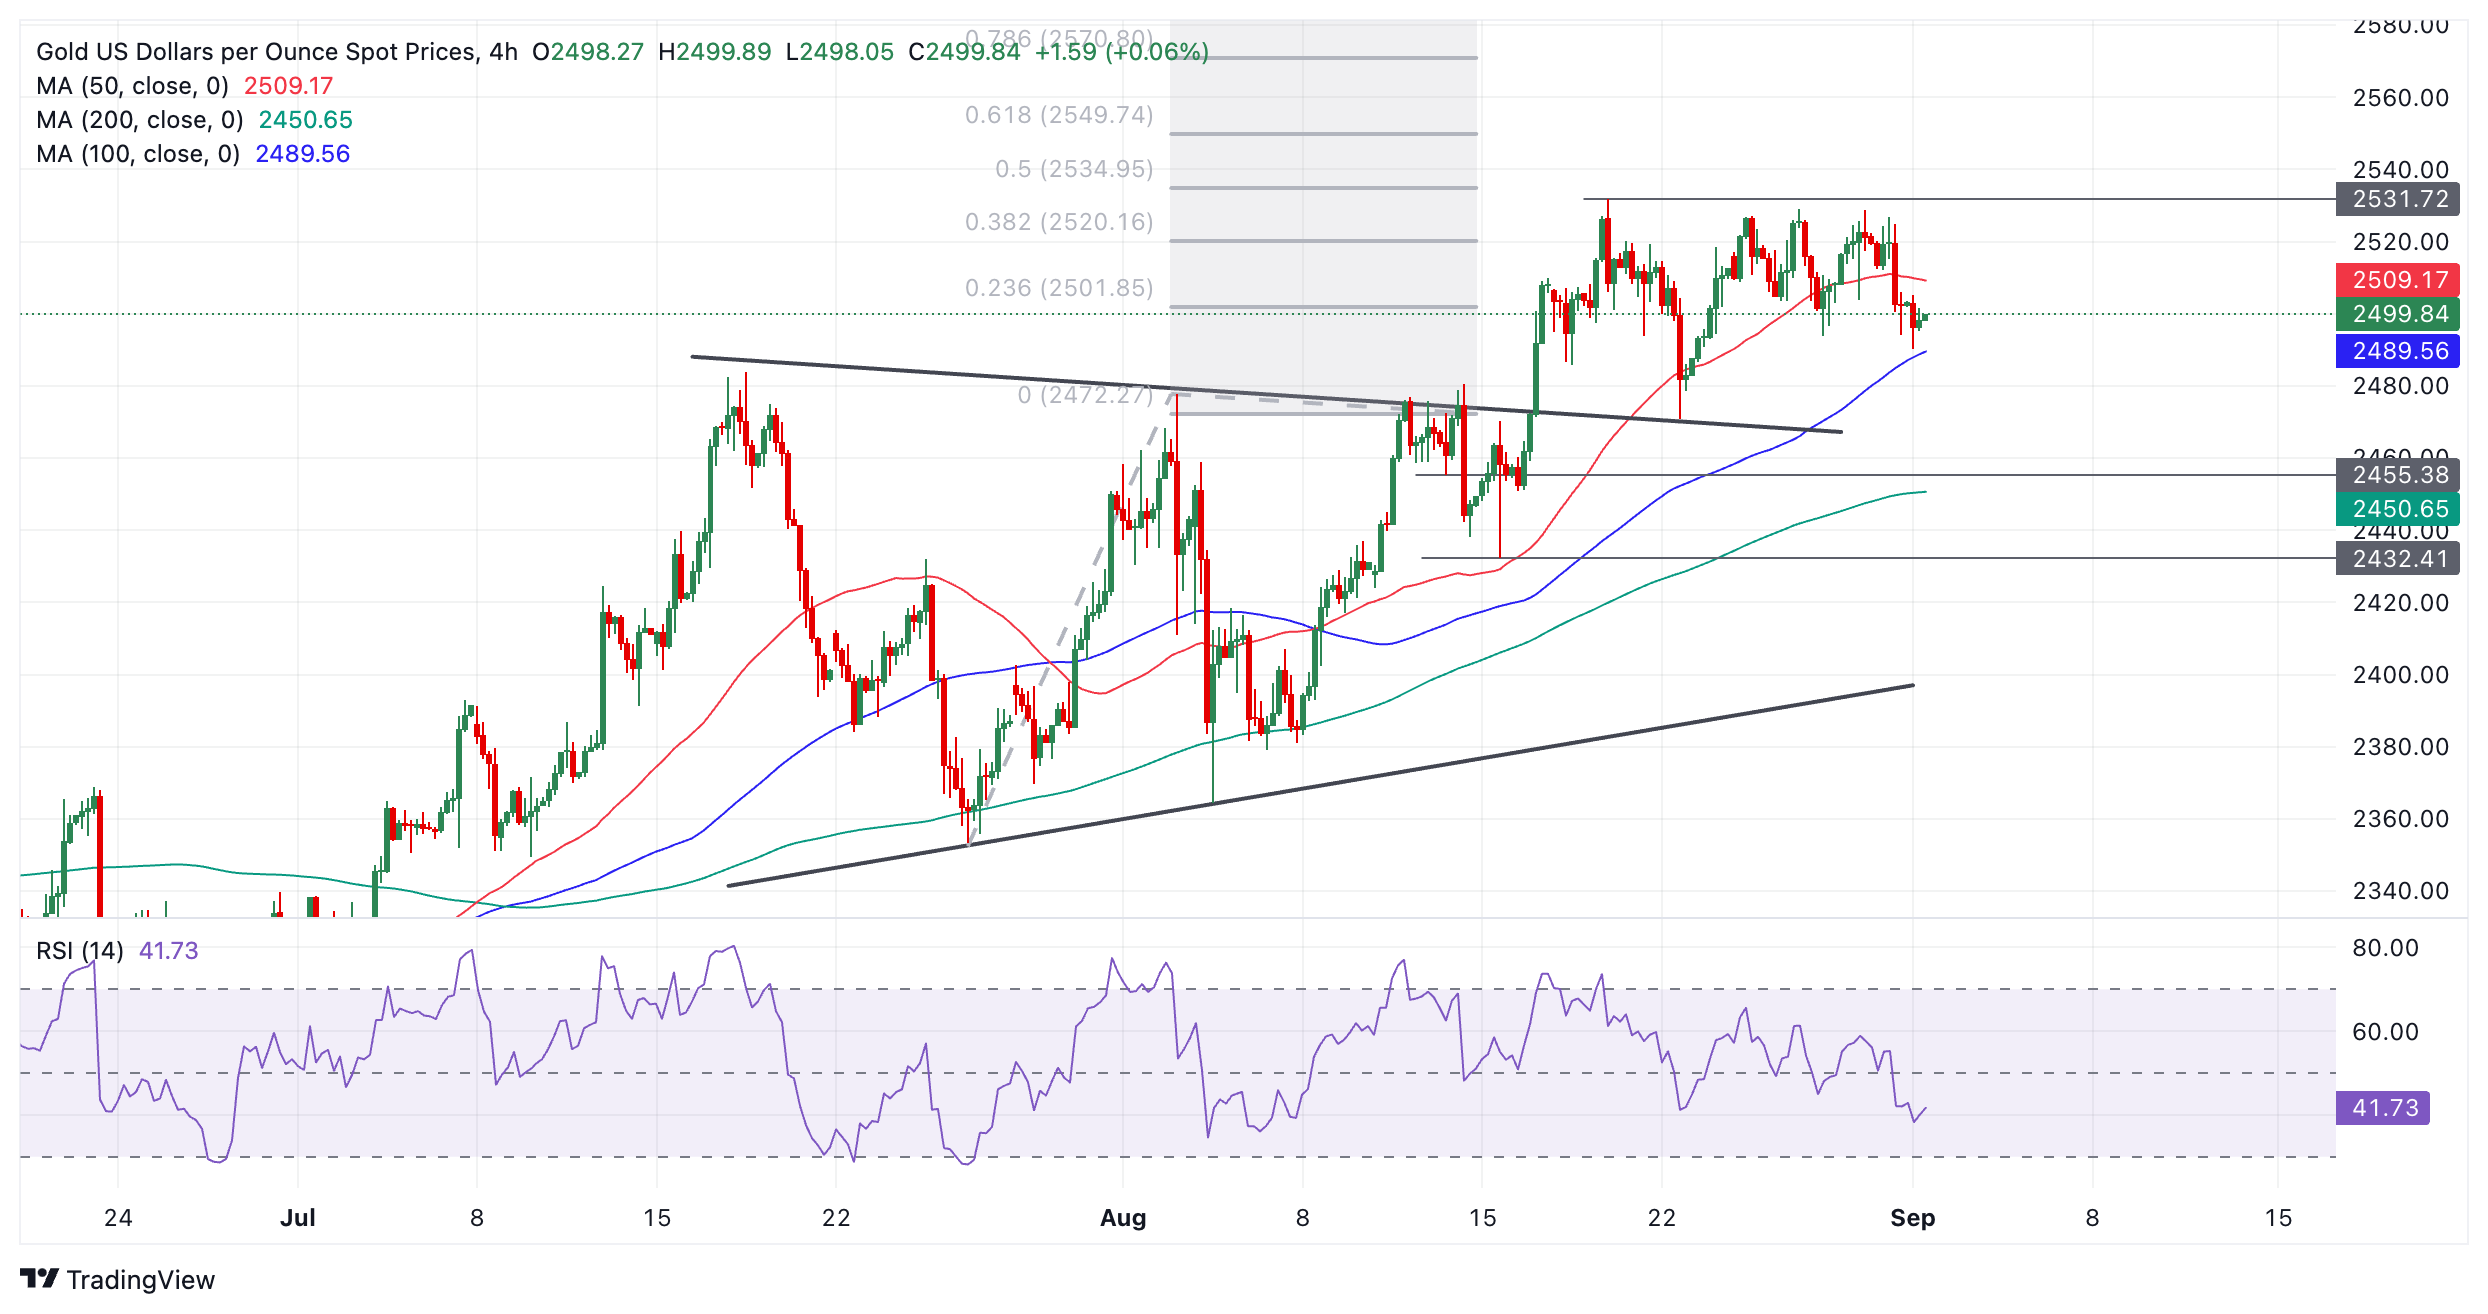
The breakout from the prior range (which resembles an incomplete triangle pattern) that occurred on August 14 generated an upside target at roughly $2,550, calculated by taking the 0.618 Fibonacci ratio of the range’s height and extrapolating it higher. This target is the minimum expectation for the follow-through from a breakout based on principles of technical analysis.
A break above the August 20 all-time high of $2,531 would provide confirmation of a continuation higher toward the $2,550 target.
Alternatively, a break back inside the previous range would negate the projected upside target. Such a move would be confirmed on a daily close below $2,470 (August 22 low). It would change the picture for Gold and suggest that the commodity might start a short-term downtrend.
Economic Indicator
Nonfarm Payrolls
The Nonfarm Payrolls release presents the number of new jobs created in the US during the previous month in all non-agricultural businesses; it is released by the US Bureau of Labor Statistics (BLS). The monthly changes in payrolls can be extremely volatile. The number is also subject to strong reviews, which can also trigger volatility in the Forex board. Generally speaking, a high reading is seen as bullish for the US Dollar (USD), while a low reading is seen as bearish, although previous months' reviews and the Unemployment Rate are as relevant as the headline figure. The market's reaction, therefore, depends on how the market assesses all the data contained in the BLS report as a whole.
Read more.Next release: Fri Sep 06, 2024 12:30
Frequency: Monthly
Consensus: 165K
Previous: 114K
Source: US Bureau of Labor Statistics
America’s monthly jobs report is considered the most important economic indicator for forex traders. Released on the first Friday following the reported month, the change in the number of positions is closely correlated with the overall performance of the economy and is monitored by policymakers. Full employment is one of the Federal Reserve’s mandates and it considers developments in the labor market when setting its policies, thus impacting currencies. Despite several leading indicators shaping estimates, Nonfarm Payrolls tend to surprise markets and trigger substantial volatility. Actual figures beating the consensus tend to be USD bullish.
Author

Joaquin Monfort
FXStreet
Joaquin Monfort is a financial writer and analyst with over 10 years experience writing about financial markets and alt data. He holds a degree in Anthropology from London University and a Diploma in Technical analysis.


