|

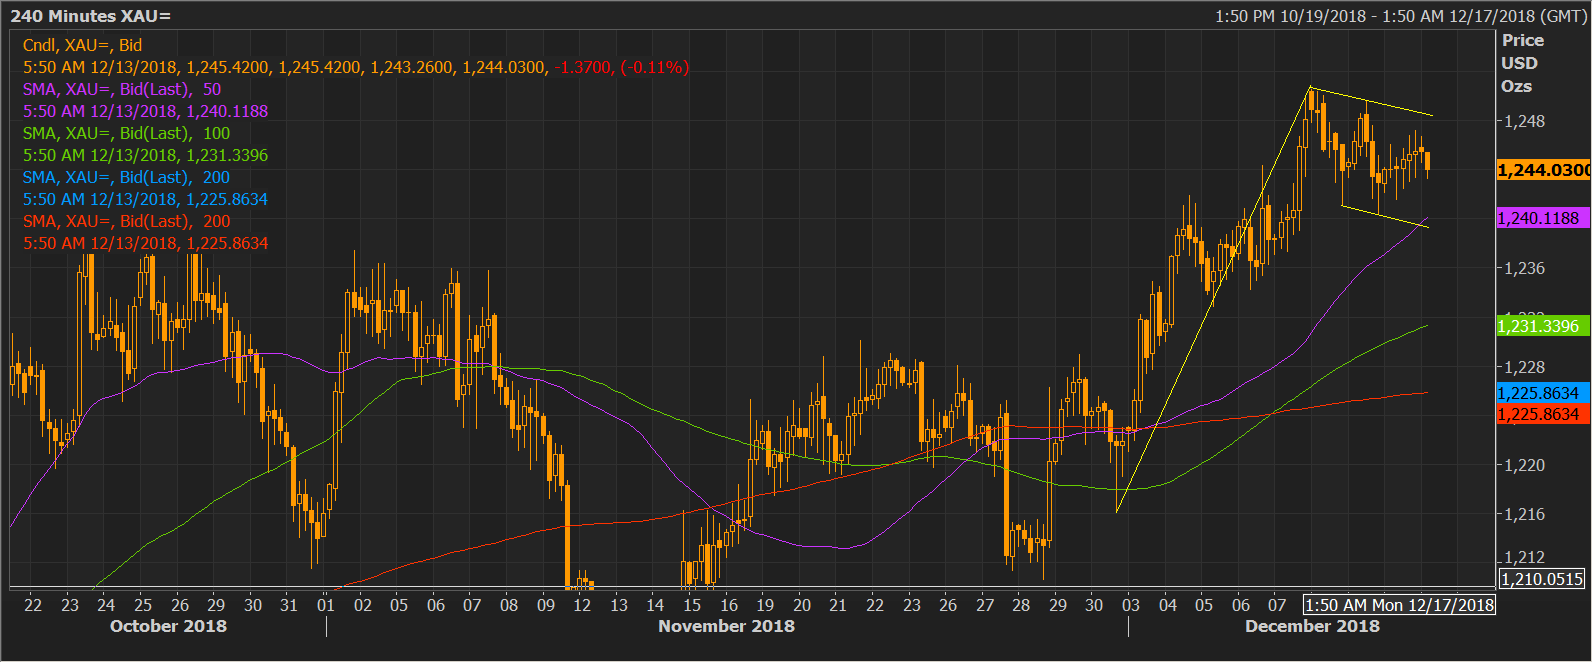
Gold Technical Analysis: yellow metal has formed a bull flag

  • Gold has created a classic bull flag -  a continuation pattern - on the 4-hour chart.
  • A convincing break above $1,248 (upper end of the flag) would signal a continuation of the rally from the low of $1,216 and would open the doors to $1,280 (target as per the measured height method - pole height added to breakout price).
  • That target may not look feasible for now. That said, the flag breakout could yield a rally to the 200-day moving average (MA), which is currently located at $1,256.
  • The key moving averages (50, 100, and 200) are trending north and located one above the other, indicating the path of least resistance is to the higher side. So, the prospects of the bullish breakout are high.

4-hour chart

Trend: Bullish

XAU/USD

Overview:
    Today Last Price: 1244.69
    Today Daily change: -1.2e+2 pips
    Today Daily change %: -0.0947%
    Today Daily Open: 1245.87
Trends:
    Previous Daily SMA20: 1229.62
    Previous Daily SMA50: 1225.61
    Previous Daily SMA100: 1212.89
    Previous Daily SMA200: 1231.76
Levels:
    Previous Daily High: 1247.21
    Previous Daily Low: 1242.1
    Previous Weekly High: 1250.1
    Previous Weekly Low: 1221.39
    Previous Monthly High: 1237.4
    Previous Monthly Low: 1196.4
    Previous Daily Fibonacci 38.2%: 1245.26
    Previous Daily Fibonacci 61.8%: 1244.05
    Previous Daily Pivot Point S1: 1242.91
    Previous Daily Pivot Point S2: 1239.95
    Previous Daily Pivot Point S3: 1237.79
    Previous Daily Pivot Point R1: 1248.02
    Previous Daily Pivot Point R2: 1250.18
    Previous Daily Pivot Point R3: 1253.14

Author

Omkar Godbole

Omkar Godbole

FXStreet Contributor

Omkar Godbole, editor and analyst, joined FXStreet after four years as a research analyst at several Indian brokerage companies.

More from Omkar Godbole
Share:

Editor's Picks

EUR/USD looks sidelined around 1.1850

EUR/USD remains on the back foot, extending its bearish tone and sliding towards the 1.1850 area to print fresh daily lows on Monday. The move lower comes as the US Dollar gathers modest traction, with thin liquidity and subdued volatility amplifying price swings amid the US market holiday.

GBP/USD flirts with daily lows near 1.3630

GBP/USD has quickly given back Friday’s solid gains, turning lower at the start of the week and drifting back towards the 1.3630 area. The focus now shifts squarely to Tuesday’s UK labour market report, which is likely to keep the quid firmly in the spotlight and could set the tone for Cable’s next move.

Gold battle around $5,000 continues

Gold is giving back part of Friday’s sharp rebound, deflating below the key $5,000 mark per troy ounce as the new week gets underway. Modest gains in the US Dollar are keeping the metal in check, while thin trading conditions, due to the Presidents Day holiday in the US, are adding to the choppy and hesitant tone across markets.

Bitcoin consolidates as on-chain data show mixed signals

Bitcoin price has consolidated between $65,700 and $72,000 over the past nine days, with no clear directional bias. US-listed spot ETFs recorded a $359.91 million weekly outflow, marking the fourth consecutive week of withdrawals.

The week ahead: Key inflation readings and why the AI trade could be overdone

It is likely to be a quiet start to the week, with US markets closed on Monday for Presidents Day. European markets are higher across the board and gold is clinging to the $5,000 level after the tamer than expected CPI report in the US reduced haven flows to precious metals.

XRP steadies in narrow range as fund inflows, futures interest rise

Ripple is trading in a narrow range between $1.45 (immediate support) and $1.50 (resistance) at the time of writing on Monday. The remittance token extended its recovery last week, peaking at $1.67 on Sunday from the weekly open at $1.43.