Gold technical analysis: Bulls challenge 100-hour SMA/38.2% Fibo. confluence resistance

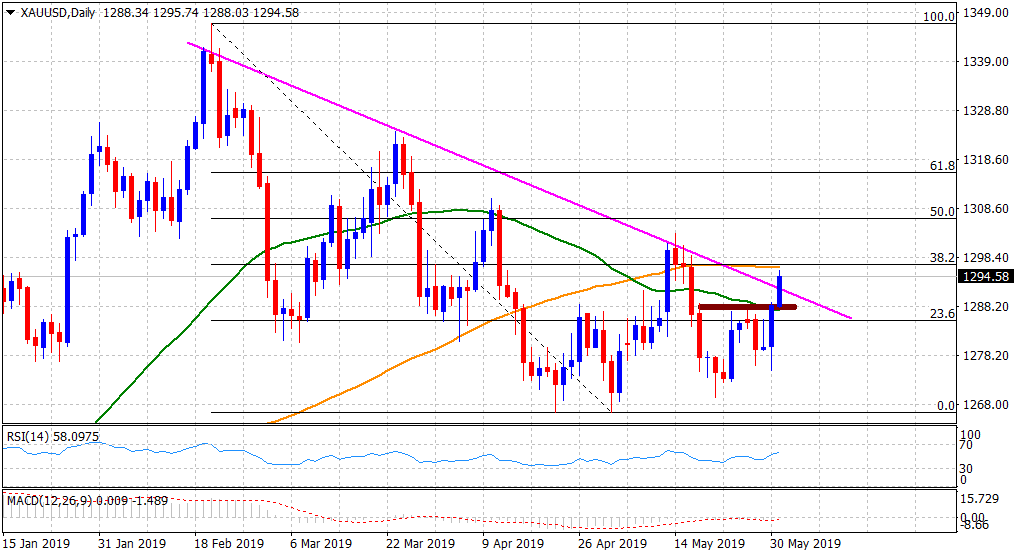
• Gold built on the overnight sharp intraday rebound from one-week lows and a subsequent break through the $1287-88 supply zone, coinciding with 50-day SMA.
• The follow-through momentum lifted the commodity beyond a descending trend-line barrier, extending from yearly tops through March/May monthly swing highs.
The precious metal has now moved closer to another confluence resistance - comprising of 100-day SMA and 38.2% Fibonacci retracement level of the $1347-$1266 downfall, which if cleared should pave the way for a further near-term appreciating move.
Meanwhile, technical indicators on the daily chart have just started gaining positive traction and support prospects for an extension of the positive move back towards monthly high, levels just beyond the key $1300 psychological mark and nearing 50% Fibo. level.
On the flip side, the $1292 horizontal level now becomes immediate support to defend. Any subsequent slide might now be seen as a buying opportunity and should remain limited near the confluence resistance break-point, around the $1288 region.
Gold daily chart
Author

Haresh Menghani
FXStreet
Haresh Menghani is a detail-oriented professional with 10+ years of extensive experience in analysing the global financial markets.


