|

Gold technical analysis: Bounces off three-month-old rising trendline

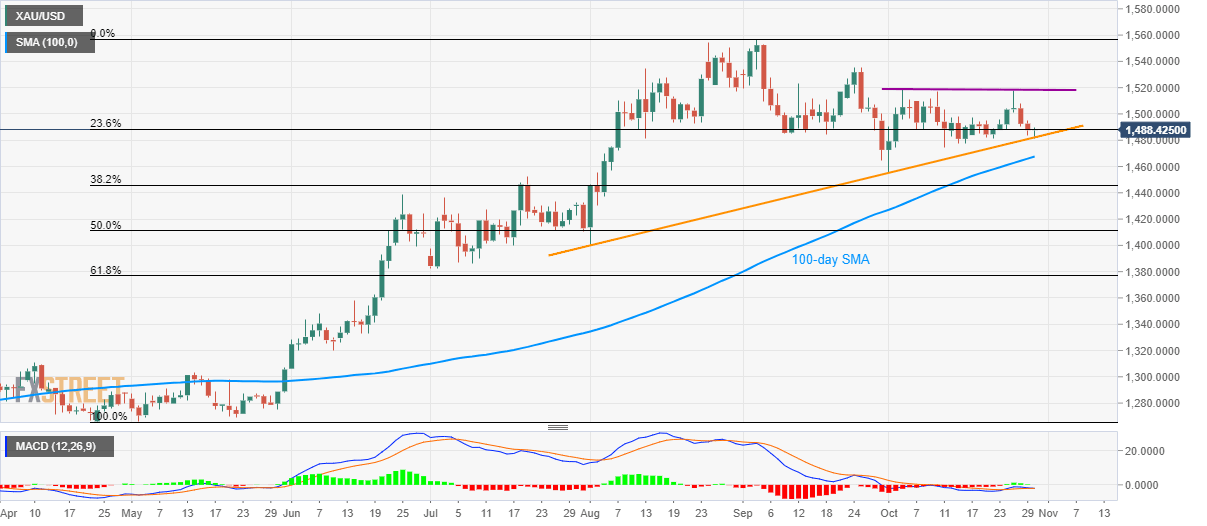
  • Gold clings to 23.6% Fibonacci retracement after a bounce from a multi-week-old support line.
  • 100-day SMA could challenge sellers targeting July top, $1,518/20 area seems to restrict immediate upside.

With the recent trade/political headlines renewing risk aversion, Gold prices take a U-turn from a three-month-old ascending support line while taking the bids to $1,489 amid Wednesday’s Asian session.

Considering the bullish signals from 12-bar Moving Average Convergence and Divergence (MACD) and the recent run for risk safety, gold is heading towards $1,500 round-figure prior to challenging a four-week long horizontal barrier, around $1,518/20.

In a case where the quote manages to cross $1,520 on a daily (D1) closing basis, $1,535 and September month top close to $1,557 will grab the buyer’s attention.

On the contrary, pair’s declines below the key support line on a D1 basis, at $1,482 now, will highlight 100-day Simple Moving Average (SMA) as the next important support, near $1,467, while July month high around $1,453/52 could lure bears then after.

Gold daily chart

Trend: pullback expected

additional important levels

Overview
Today last price1489.15
Today Daily Change1.45
Today Daily Change %0.10%
Today daily open1487.7
 
Trends
Daily SMA201494.82
Daily SMA501504.54
Daily SMA1001466.03
Daily SMA2001382.81
 
Levels
Previous Daily High1494.8
Previous Daily Low1483.98
Previous Weekly High1517.92
Previous Weekly Low1481.05
Previous Monthly High1557.03
Previous Monthly Low1464.61
Daily Fibonacci 38.2%1488.11
Daily Fibonacci 61.8%1490.67
Daily Pivot Point S11482.85
Daily Pivot Point S21478.01
Daily Pivot Point S31472.03
Daily Pivot Point R11493.67
Daily Pivot Point R21499.65
Daily Pivot Point R31504.49

Author

Anil Panchal

Anil Panchal

FXStreet

Anil Panchal has nearly 15 years of experience in tracking financial markets. With a keen interest in macroeconomics, Anil aptly tracks global news/updates and stays well-informed about the global financial moves and their implications.

More from Anil Panchal
Share:

Editor's Picks

EUR/USD deflates to fresh lows, targets 1.1600

The selling pressure on EUR/USD now gathers extra pace, prompting the pair to hit fresh multi-week lows in the 1.1625-1.1620 band on Friday. The continuation of the downward bias comes in response to further gains in the US Dollar as market participants continue to assess the mixed release of US Nonfarm Payrolls in December.

GBP/USD breaks below 1.3400, challenges the 200-day SMA

GBP/USD remains under heavy fire and retreats for the fourth consecutive day on Friday. Indeed, Cable suffers the strong performance of the Greenback, intensified post-mixed NFP, and trades at shouting distance from its critical 200-day SMA near 1.3380.

Gold flirts with yearly tops around $4,500

Gold keeps its positive bias on Friday, adding to Thursday’s advance and challenging yearly highs in the $4,500 region per troy ounce. The risk-off sentiment favours the yellow metal despite the firmer tone in the Greenback and rising US Treasury yields.

Crypto Today: Bitcoin, Ethereum, XRP risk further decline as market fear persists amid slowing demand

Bitcoin holds $90,000 but stays below the 50-day EMA as institutional demand wanes. Ethereum steadies above $3,000 but remains structurally weak due to ETF outflows. XRP ETFs resume inflows, but the price struggles to gain ground above key support.

Week ahead – US CPI might challenge the geopolitics-boosted Dollar

Geopolitics may try to steal the limelight from US data. A possible US Supreme Court ruling on tariffs could dictate market movements. A crammed data calendar next week, US CPI comes on Tuesday; Fedspeak to intensify.

XRP trades under pressure amid weak retail demand

XRP presses down on the 50-day EMA support as risk-averse sentiment spreads despite a positive start to 2026. XRP faces declining retail demand, as reflected in futures Open Interest, which has fallen to $4.15 billion.