Gold technical analysis: 61.8% Fibo limits immediate upside amid bullish MACD
- Gold holds on to recovery gains above 50% Fibonacci retracement.
- Bullish MACD indicates further upside.
- A break of 61.8% Fibonacci retracement will recall late-September highs.

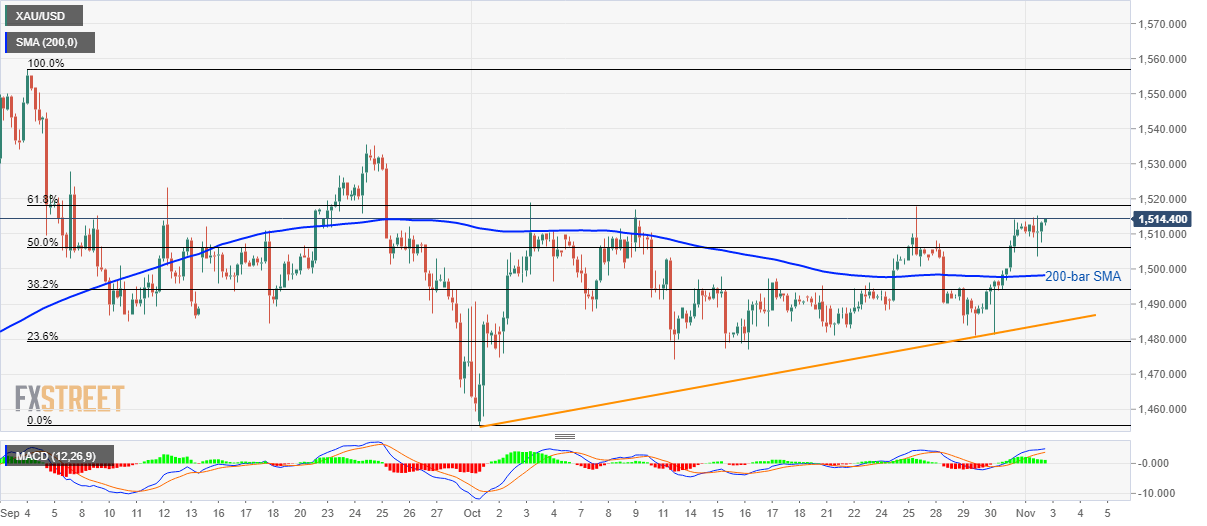
With the sustained trading beyond 50% Fibonacci retracement of September-October upside, Gold is now gearing up to confront another key resistance while taking the bids to $1,514 during the initial Asian session on Monday.
In doing to 61.8% Fibonacci retracement level of $1,519 will be the first, and the key, to watch for, a break of which could escalate the recent recovery towards late-September high near $1,535.
It’s worth mentioning that 12-bar Moving Average Convergence and Divergence (MACD) is indicating a bullish signal and hence further upside to the key resistance seems quite an expected outcome.
Should there be further upside beyond $1,535, $1,550 and September month high close to $1557/58 will appear on buyers’ radar.
Meanwhile, a downside break below 50% Fibonacci retracement level of $1,506 highlights the importance of a 200-bar Simple Moving Average (SMA) level of $1,498 and a monthly rising trend line around $1,484.
During the metal’s declines under $1,484, $1,478 and the previous month low surrounding $1,455 could lure sellers.
Gold 4-hour chart
Trend: pullback expected
Author

Anil Panchal
FXStreet
Anil Panchal has nearly 15 years of experience in tracking financial markets. With a keen interest in macroeconomics, Anil aptly tracks global news/updates and stays well-informed about the global financial moves and their implications.


