Gold trades in a range, edges lower after robust US services sector data
- Gold oscillates in a tight range after bets fade that the Fed will continue slashing interest rates aggressively.
- Support for Gold comes from increasing geopolitical risks and lower interest rates globally.
- Technically, XAU/USD begins a leg lower within a tight range.

Gold (XAU/USD) edges lower to trade in the $2,640s per troy ounce on Thursday as it continues its consolidate below the record high of $2,685 set last week. Sellers have the edge over buyers as bets fade that the Federal Reserve (Fed) will continue slashing interest rates aggressively in the United States (US), which, in turn, takes the shine off non-interest-bearing assets like Gold.
Data out on Thursday backs up the view that the US economy is ticking over relatively well after Services sector activity showed a rise in September.
The US ISM Services Purchasing Manager Index (PMI) rose to 54.9 in September from 51.5 in August, and beat estimates of 51.7, according to data from the Institute of Supply Management (ISM) on Thursday.
The data showed the ISM Services Employment Index fell to 48.1 which was below the previous month’s 50.2.
The ISM Prices Paid Index, meanwhile, showed a rise to 59.4 from 57.3 prior and 56.3 expected.
The data came after S&P Global’s Composite PMI for the US fell to 54.0 from 54.2 and the same expected, and S&P Services PMI declined to 55.2 from 55.4 previous and the same expected in September.
Gold's downside is limited, however, by support from two key factors: safe-haven flows into Gold due to the fear of an escalation of the conflict in the Middle East and the general trend lower in global interest rates – notwithstanding the Fed’s newfound caution – which enables Gold to still retain its overall attractiveness to investors.
Gold stalls in its ascent as Fed backtracks
Gold continues to see upside capped by seesawing expectations regarding the future course of interest rates in the US. From the chances of the Fed cutting interest rates by another double-dose 50 basis points (0.50%) again in November, standing above 60% last week, these have now fallen to a much less certain level of around mid-30%.
The fall in market bets comes after the release of stronger-than-expected US jobs data, which suggests the US economy is not tilting on a cliff edge. This, in turn, has enabled the Dollar to resurface from its deep dive in August, providing a further headwind to Gold, which is mostly priced and traded in USD. Regarding the health of the US labor market, the release of the most important US employment report, the Nonfarm Payrolls (NFP), will be a critical deciding factor on Friday.
Technical Analysis: Gold enters short-term sideways mode
Gold enters a sideways market mode on the 4-hour chart (below) between the all-time high of $2,685 and a floor at around Monday’s low of $2,625. The short-term trend is unclear and could now possibly be sideways. It would require a breakout either above the top of the range or below the bottom to confirm a new directional bias.
XAU/USD 4-hour Chart
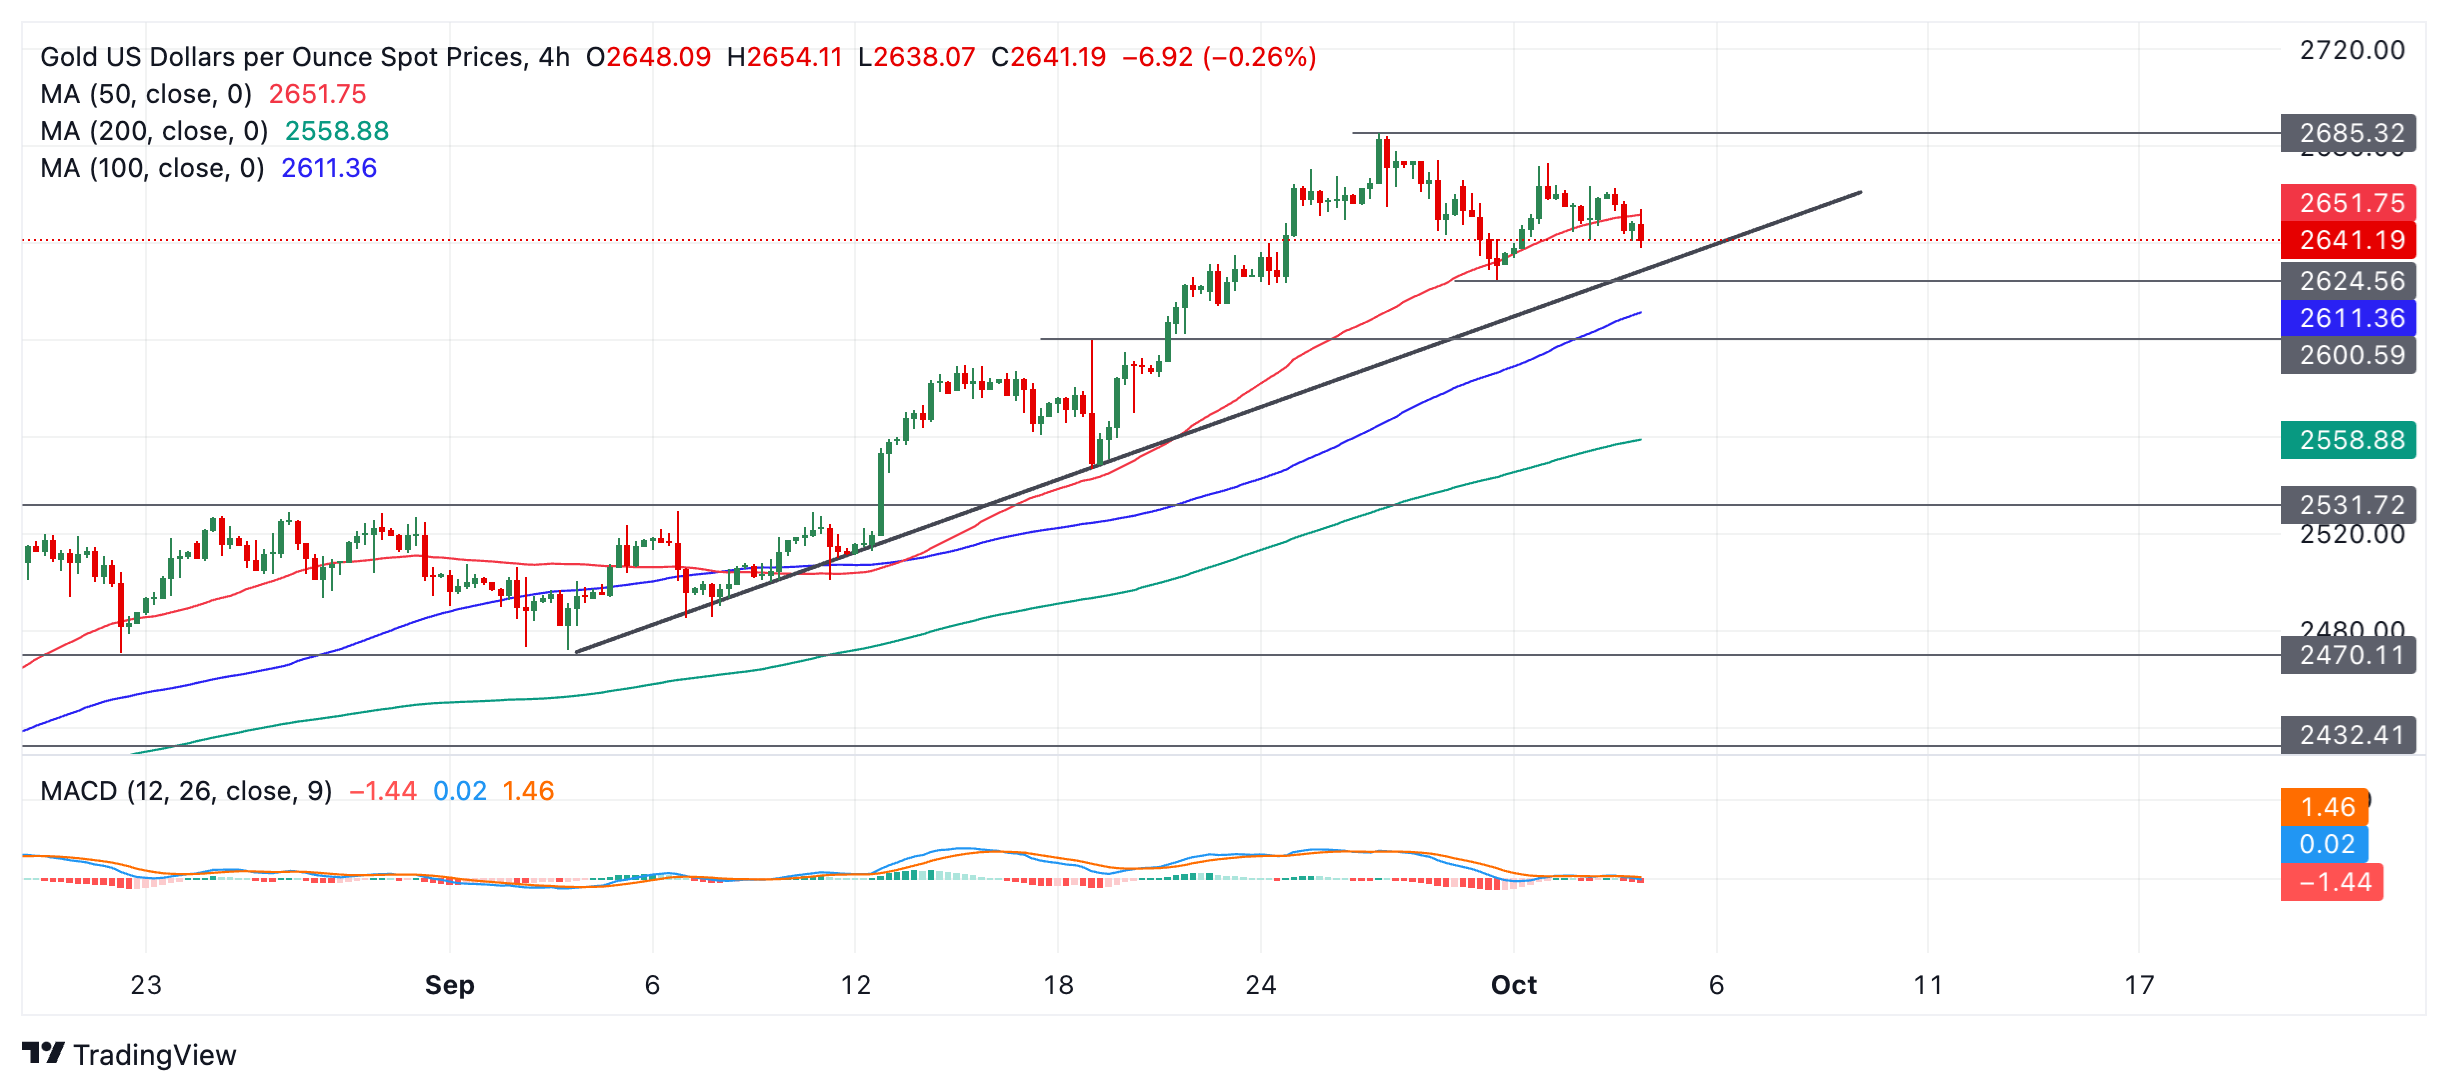
A break above the $2,673 Tuesday’s high would, however, increase the odds of a resumption of the old uptrend, probably leading to a continuation up to the round-number target at $2,700.
Gold is successfully piercing below the red 50-period Simple Moving Average (SMA) on the chart above, however, which suggests building downside pressure.
Support then follows from the trendline at $2,630. A break below the $2,625 swing low would likely see prices give way to support at $2,600 (August 20 high, round number).
On a medium and long-term basis, Gold remains in an uptrend and, since it is a foundational principle of technical analysis that “the trend is your friend,” the odds favor resumption higher eventually once the current period of consolidation has ended.
Economic Indicator
ISM Services PMI
The Institute for Supply Management (ISM) Services Purchasing Managers Index (PMI), released on a monthly basis, is a leading indicator gauging business activity in the US services sector, which makes up most of the economy. The indicator is obtained from a survey of supply executives across the US based on information they have collected within their respective organizations. Survey responses reflect the change, if any, in the current month compared to the previous month. A reading above 50 indicates that the services economy is generally expanding, a bullish sign for the US Dollar (USD). A reading below 50 signals that services sector activity is generally declining, which is seen as bearish for USD.
Read more.Last release: Thu Oct 03, 2024 14:00
Frequency: Monthly
Actual: 54.9
Consensus: 51.7
Previous: 51.5
Source: Institute for Supply Management
The Institute for Supply Management’s (ISM) Services Purchasing Managers Index (PMI) reveals the current conditions in the US service sector, which has historically been a large GDP contributor. A print above 50 shows expansion in the service sector’s economic activity. Stronger-than-expected readings usually help the USD gather strength against its rivals. In addition to the headline PMI, the Employment Index and the Prices Paid Index numbers are also watched closely by investors as they provide useful insights regarding the state of the labour market and inflation.
Author

Joaquin Monfort
FXStreet
Joaquin Monfort is a financial writer and analyst with over 10 years experience writing about financial markets and alt data. He holds a degree in Anthropology from London University and a Diploma in Technical analysis.

















