Gold falls, moving in line with bearish technicals as US Dollar recovers
- Gold is falling in line with a bearish short-term technical picture and a US Dollar bounce.
- Lower global inflation expectations are prompting investors to rotate into bonds, possibly draining investment away from Gold.
- XAU/USD technicals indicate the potential for more downside following a recent trendline break.

Gold (XAU/USD) trades over a percent lower in the $2,320s on Tuesday. A bounce by the US Dollar (USD) – which is negatively correlated to Gold – could be partly responsible, as could asset rotation into bonds. Commodities in general are trading lower, and the move is in line with Gold technicals which are short-term bearish.
This week is big for US jobs data and JOLTS job openings have just hit the headlines after recording a lower-than-expected 8.059 million openings in April, which was below both the 8.34M expected, and the 8.355M in March, according to data from the US Bureau of Labour Statistics. The data suggests a deterioration in the US job market. The US Nonfarm Payrolls (NFP) labor report for May, out on Friday is the big market mover this week and the JOLTS miss is a something of a bad omen. If reflected in the NFP data it could weigh on USD, supporting Gold.
Gold weakens as broader commodity markets sell-off
The lion’s share of commodities and most equity markets are selling off on Tuesday, which – apart from idiosyncratic reasons such as the OPEC+ decision and Indian elections – seems to be a result of generalized fears about global economic growth. This seems to be due to the poor US ISM Manufacturing PMI data released on Monday. Another reason could be asset rotation as increasing numbers of investors reallocate to bonds.
There are growing signs inflation is falling globally, with Friday’s US core PCE data undershooting estimates and Swiss inflation similarly missing the mark on Tuesday, after coming out at 0.3% month-over-month in May when economists had estimated a 0.4% rise.
The Swiss CPI data has sparked speculation the Swiss National Bank (SNB) could make another interest rate cut at its meeting in June. With the European central Bank (ECB) highly anticipated to cut interest rates on Thursday and increasing speculation the Bank of Canada (BoC) could also cut rates on Wednesday, global bond markets are rallying and could be draining investment from Gold.
Technical Analysis: Gold trades along 50-day SMA
Gold price is finding support at the 50-day Simple Moving Average (SMA) and consolidating after a sell-off from the May highs.
XAU/USD has broken through a major trendline and is probably in a short-term downtrend. Given “the trend is your friend” the odds favor more weakness.
XAU/USD Daily Chart
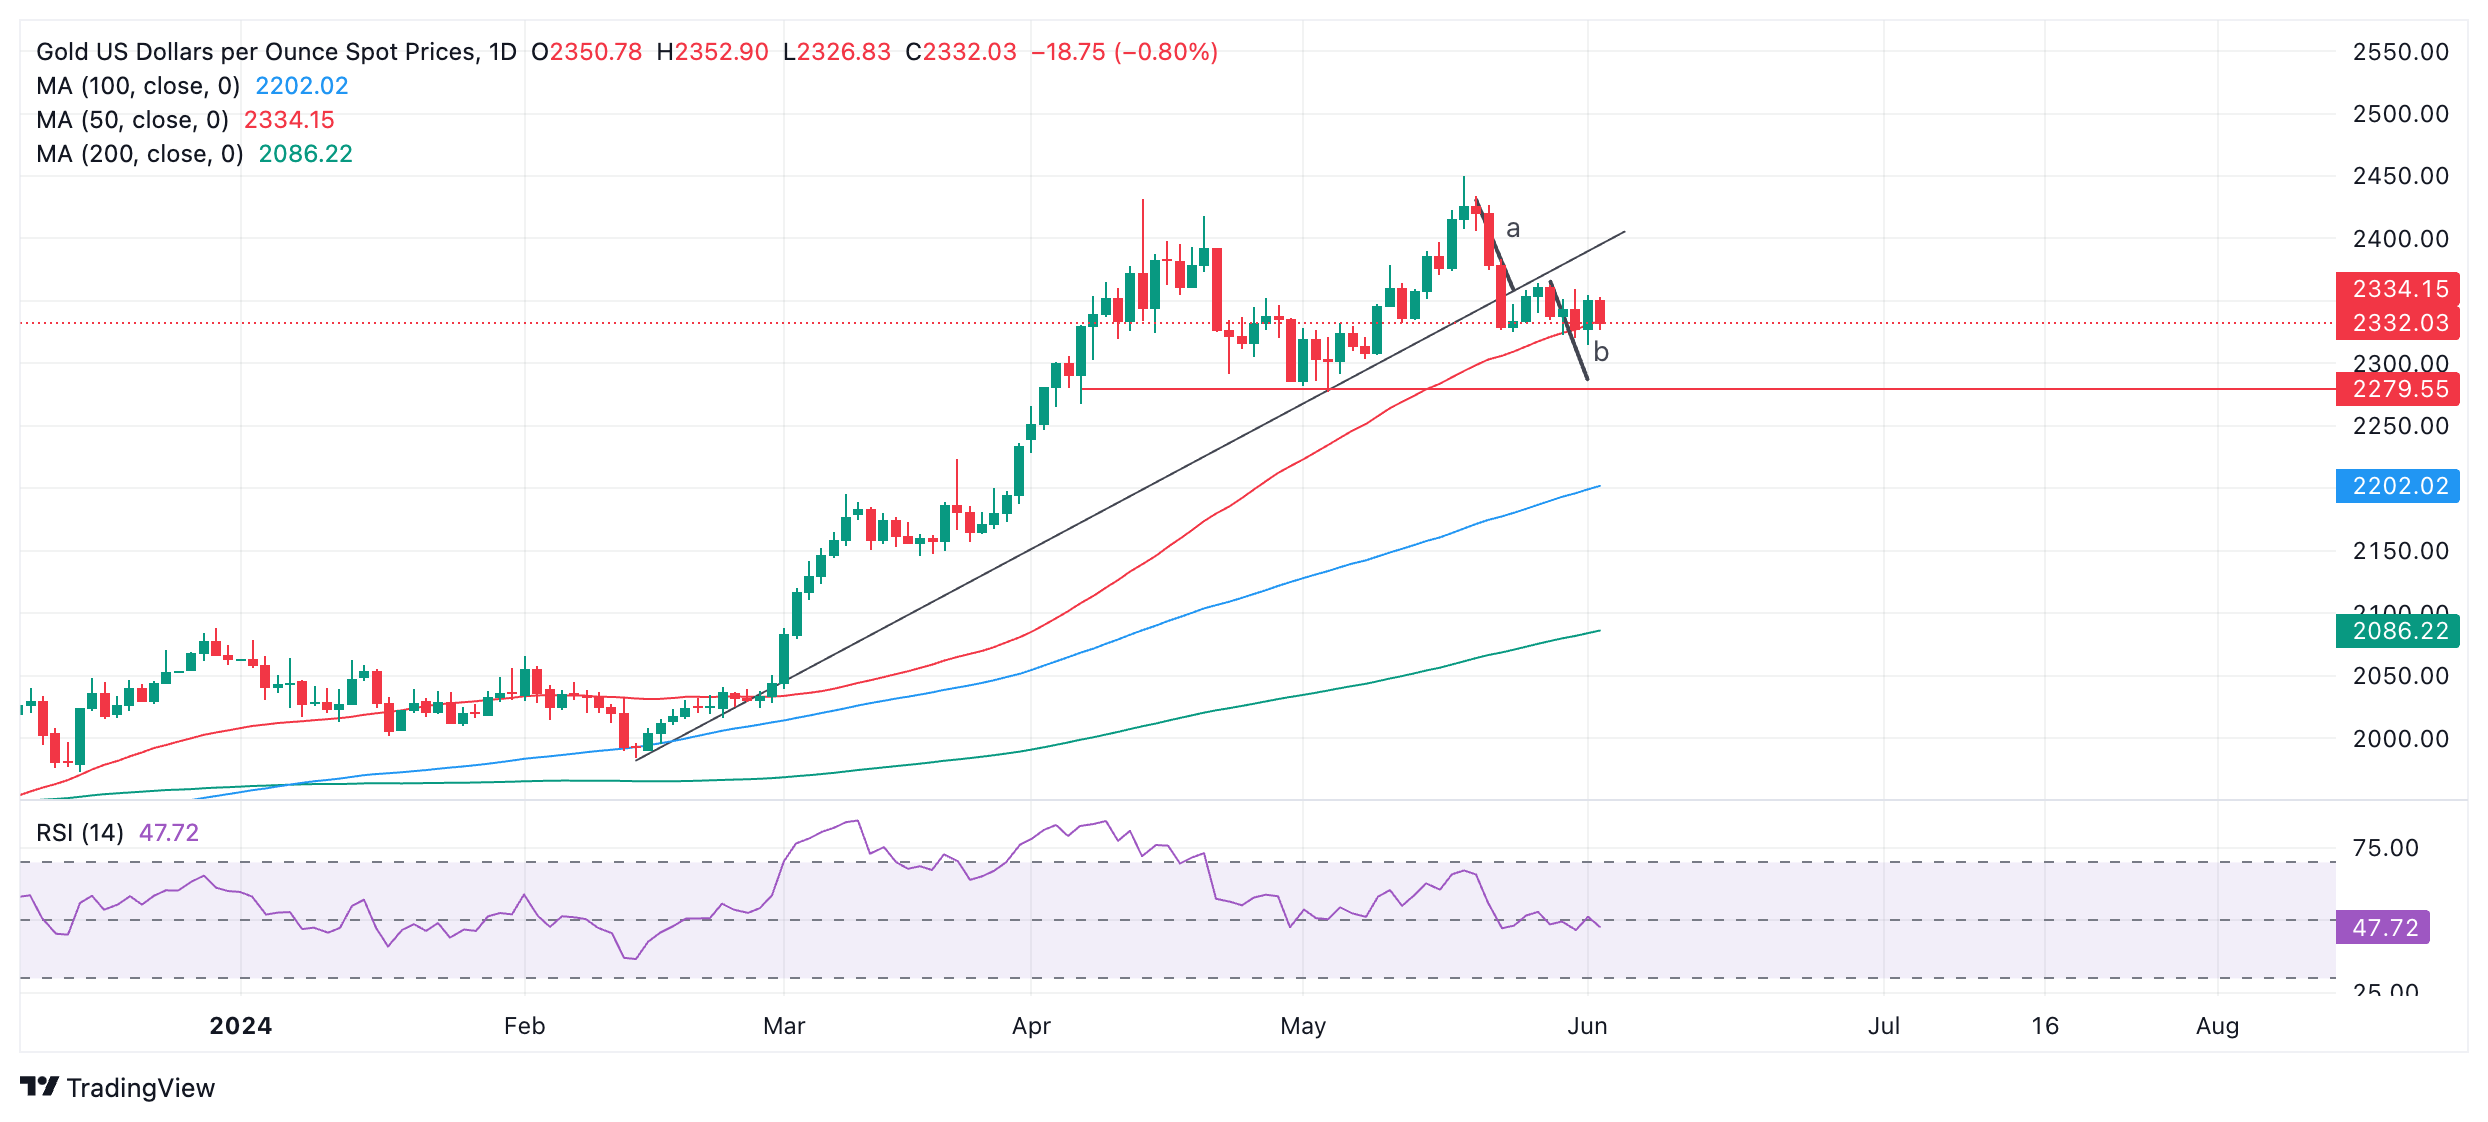
The trendline break generated downside targets. The length of the move prior to a break can be used as a guide to the follow-through after a break, according to technical analysis. In the case of Gold, these have been labeled “a” and “b” respectively.
The first target is at $2,303, which is the 0.618 Fibonacci extrapolation of “a”.
Gold could even fall to $2,272-$2,279, the 100% extrapolation of “a” and the end of “b”. This also happens to be an area of historical support (red line).
The precious metal’s medium and long-term trends, however, are still bullish and the risk of a recovery remains high. That said, price action is not supporting a resumption hypothesis at the moment.
A break above $2,362 (May 29 high) would be required to bring into doubt the integrity ofthe short-term downtrend, otherwise further weakness is foreseen.
Economic Indicator
JOLTS Job Openings
JOLTS Job Openings is a survey done by the US Bureau of Labor Statistics to help measure job vacancies. It collects data from employers including retailers, manufacturers and different offices each month.
Read more.Last release: Tue Jun 04, 2024 14:00
Frequency: Monthly
Actual: 8.059M
Consensus: 8.34M
Previous: 8.488M
Source: US Bureau of Labor Statistics
Author

Joaquin Monfort
FXStreet
Joaquin Monfort is a financial writer and analyst with over 10 years experience writing about financial markets and alt data. He holds a degree in Anthropology from London University and a Diploma in Technical analysis.


