Gold Price Analysis: XAU/USD preparing for take-off from daily structure
- Gold is testing a critical resistance structure with sights on higher prices.
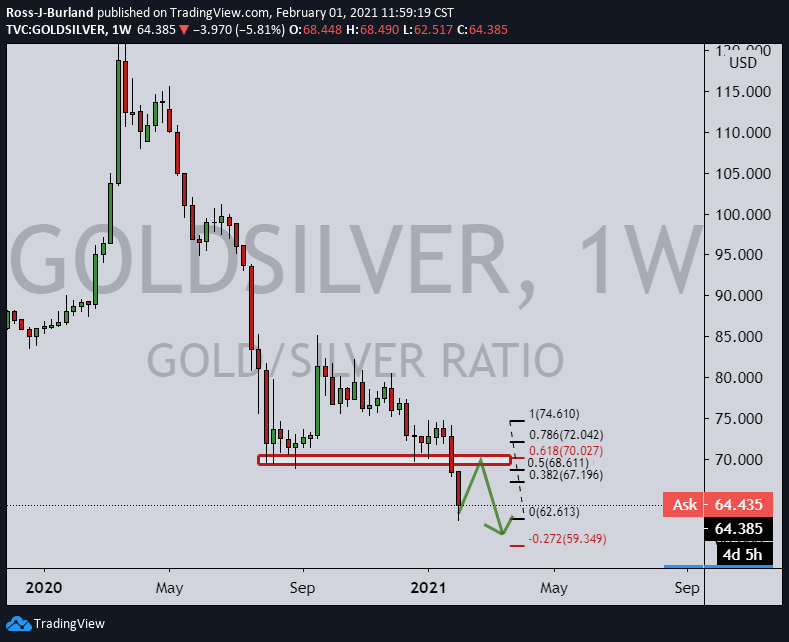
- US yields are on the backfoot, while the Gold/Silver ratio could be on the verge of an upside correction.

Gold prices are elevated at the start of the week, trading almost 1% higher at $1,864.89 at the time of writing, having travelled from a low of $1,847.74 to a high of $1,871.89 on the day so far.
Gold prices are bid despite a firm US dollar, correlated ore so to slumping US yields on the day, (see below).
Instead, the price of silver in an eye-watering rally pertaining to the Reddit movement has seen the ratio to gold dump to the lowest levels since the summer of 2014.
Gold, therefore, could well be playing catch-up with silver and there is some way to go yet before resistance.
Should silver pause, then gold can take-off and do all of the leg work towards a 50% mean reversion in the ratio towards the old support structure on the weekly chart:
There is further analysis of the price of silver below that argues the case for a deeper correction from the highest prices since 2013 before even higher prices can be achieved.
Meanwhile, analysts at TD Securities argued that ''while an engineered short squeeze in silver is a more difficult task relative to last week's tumultuous squeeze in several highly shorted and illiquid stocks, and the motives are muddied by hedge fund and bank bullishness, the effort can certainly keep prices and volatility elevated in the near-term.''
With respect to gold price, the analysts at TDS note that ''the bulls are increasingly relying on slumping Treasury yields, rather than rising inflation expectations, to fuel lower real rates.''
US 10-year yields are indeed lower today, travelling from a high of 1.089% to a low of 1.060% and down some 0.48% at the time of writing.
Technically, there is the argument for lower levels according to the following analysis:
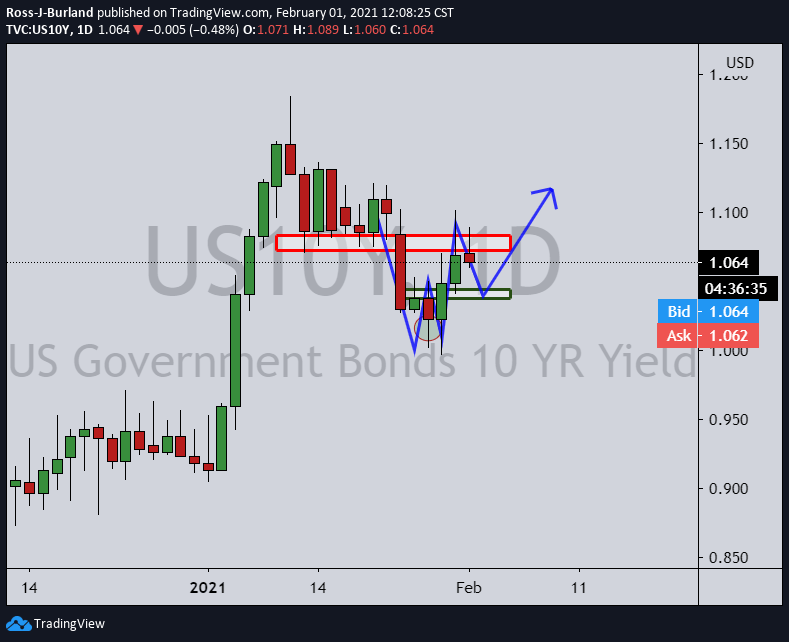
Should the yield fall to the neck-line of the W-formation, then gold has room to travel a little higher. If the neckline support gives way to pressures, then gold can continue moving up.
Gold technical analysis
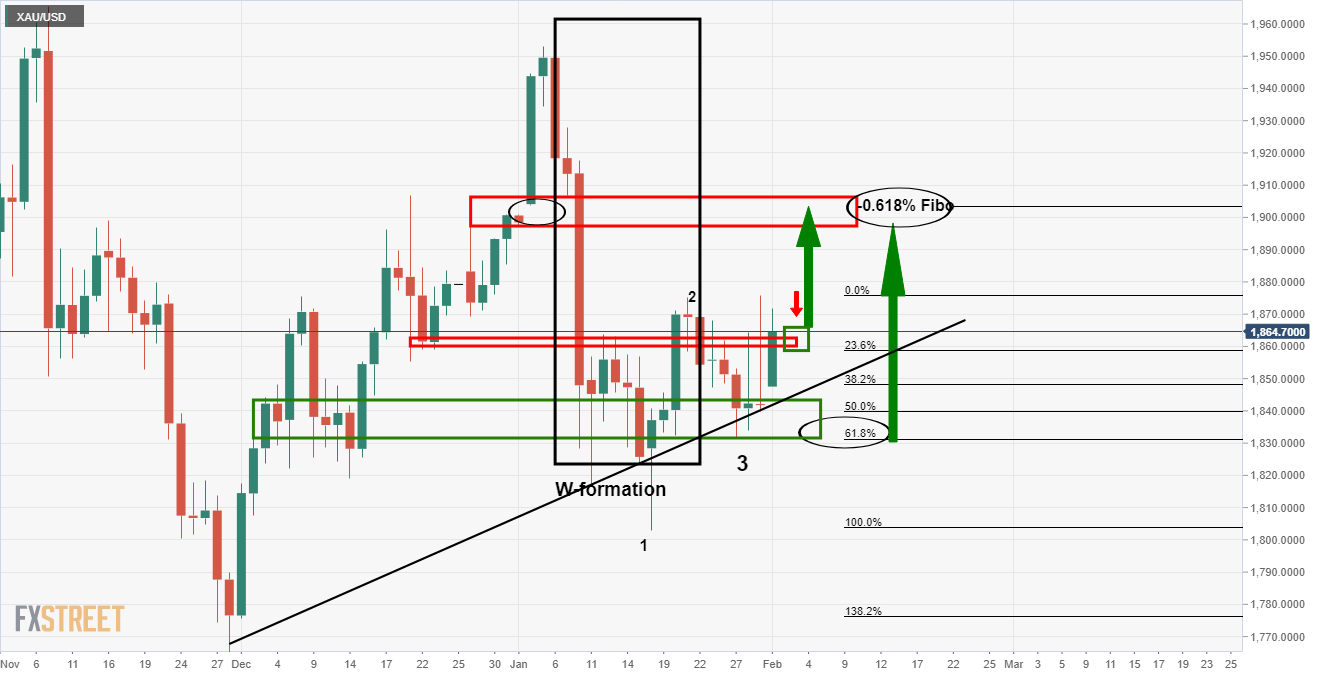
As illustrated, gold prices, from a daily perspective, have been moving up in a choppy incline.
The price action has formed a bullish structure whereby the W-formation's neckline pulled in offers to a 61.8% Fibonacci retracement of the W-formation's bullish impulse.
This area has been marked as support and the price has since rallied to test the resistance area.
The price is currently trying to drive through it while supported by the dynamic trendline support as well.
A break here, could with falling yields, a correction gold/silver ratio and a dip on the US dollar would all align for a bullish scenario towards a target at the -0.618% Fibonacci retracement of the latest correction's range which meets overhead resistance structure.
Silver technical analysis
As per the Chart of the Week's analysis, The Chart of the Week: The Silver rush and big short squeeze kicks-in, the price has indeed rallied to the expected resistance area and target, $30.05 (the pin bar highs was $30.13), and has since moved back.
However, a deeper correction could be on the cards if support gives way, with eyes on a 50% mean reversion of the daily lows and highs.
4-hour chart
-637478006494237034.png)
Author

Ross J Burland
FXStreet
Ross J Burland, born in England, UK, is a sportsman at heart. He played Rugby and Judo for his county, Kent and the South East of England Rugby team.


