Gold price struggles to capitalize on intraday bounce from one-week low; US-China trade talks awaited
- Gold price reverses an intraday slide to sub-$3,300 levels amid a weaker USD.
- Rising geopolitical risks lend additional support to the safe-haven precious metal.
- Friday’s US NFP report tempered Fed rate cut bets and caps the XAU/USD pair.

Gold price (XAU/USD) sticks to modest intraday recovery gains through the first half of the European session and for now, seems to have snapped a two-day losing streak. The US Dollar (USD) struggles to capitalize on Friday's gains, amid US fiscal concerns, and turns out to be a key factor that assists the bullion to reverse an intraday dip to sub--$3,300 levels, or a one-week low.
Apart from this, rising geopolitical tensions and persistent trade-related uncertainties act as a tailwind for the safe-haven Gold price. However, Friday's stronger US jobs data dampened hopes for imminent interest rate cuts by the Federal Reserve (Fed) this year, which, in turn, acts as a headwind for the non-yielding yellow metal. Traders also seem reluctant ahead of US-China trade talks.
Daily Digest Market Movers: Gold price remains supported by weaker USD as traders await trade headlines
- The closely-watched Nonfarm Payrolls report published by the US Bureau of Labor Statistics (BLS) on Friday showed that the economy added 139K new jobs in May compared to the previous month's downwardly revised reading of 147K. This, however, was still higher than the market expectation for 130K.
- Additional details revealed that the Unemployment Rate held steady at 4.2%, as anticipated, while Average Hourly Earnings remained unchanged at 3.9%, beating consensus estimates of 3.7%. The data prompted market participants to trim bets that the Federal Reserve will cut interest rates this year.
- Following the report, US President Donald Trump intensified his pressure campaign against Federal Reserve Chair Jerome Powell and urged him to cut rates by a full percentage point. Moreover, traders are still pricing in a greater possibility that the Fed will lower borrowing costs in September.
- Adding to this, a fresh leg down in the US Treasury bond yields undermines the US Dollar and assists the Gold price to attract some dip-buyers at the start of a new week.
- This, along with concerns about the US government's financial health, fails to assist the US Dollar to capitalize on the post-NFP gains. Furthermore, an escalation in the Russia-Ukraine conflict, amid stalled peace talks, keeps the geopolitical risks in play and supports the safe-haven commodity.
- Top US and Chinese officials will meet in London on Monday for negotiations aimed at defusing the high-stakes trade dispute between the world's two largest economies. US President Donald Trump said last week that a call with the Chinese leader Xi Jinping resulted in a very positive conclusion.
Gold price bears need to wait for acceptance below the $3,300 mark before placing fresh bets
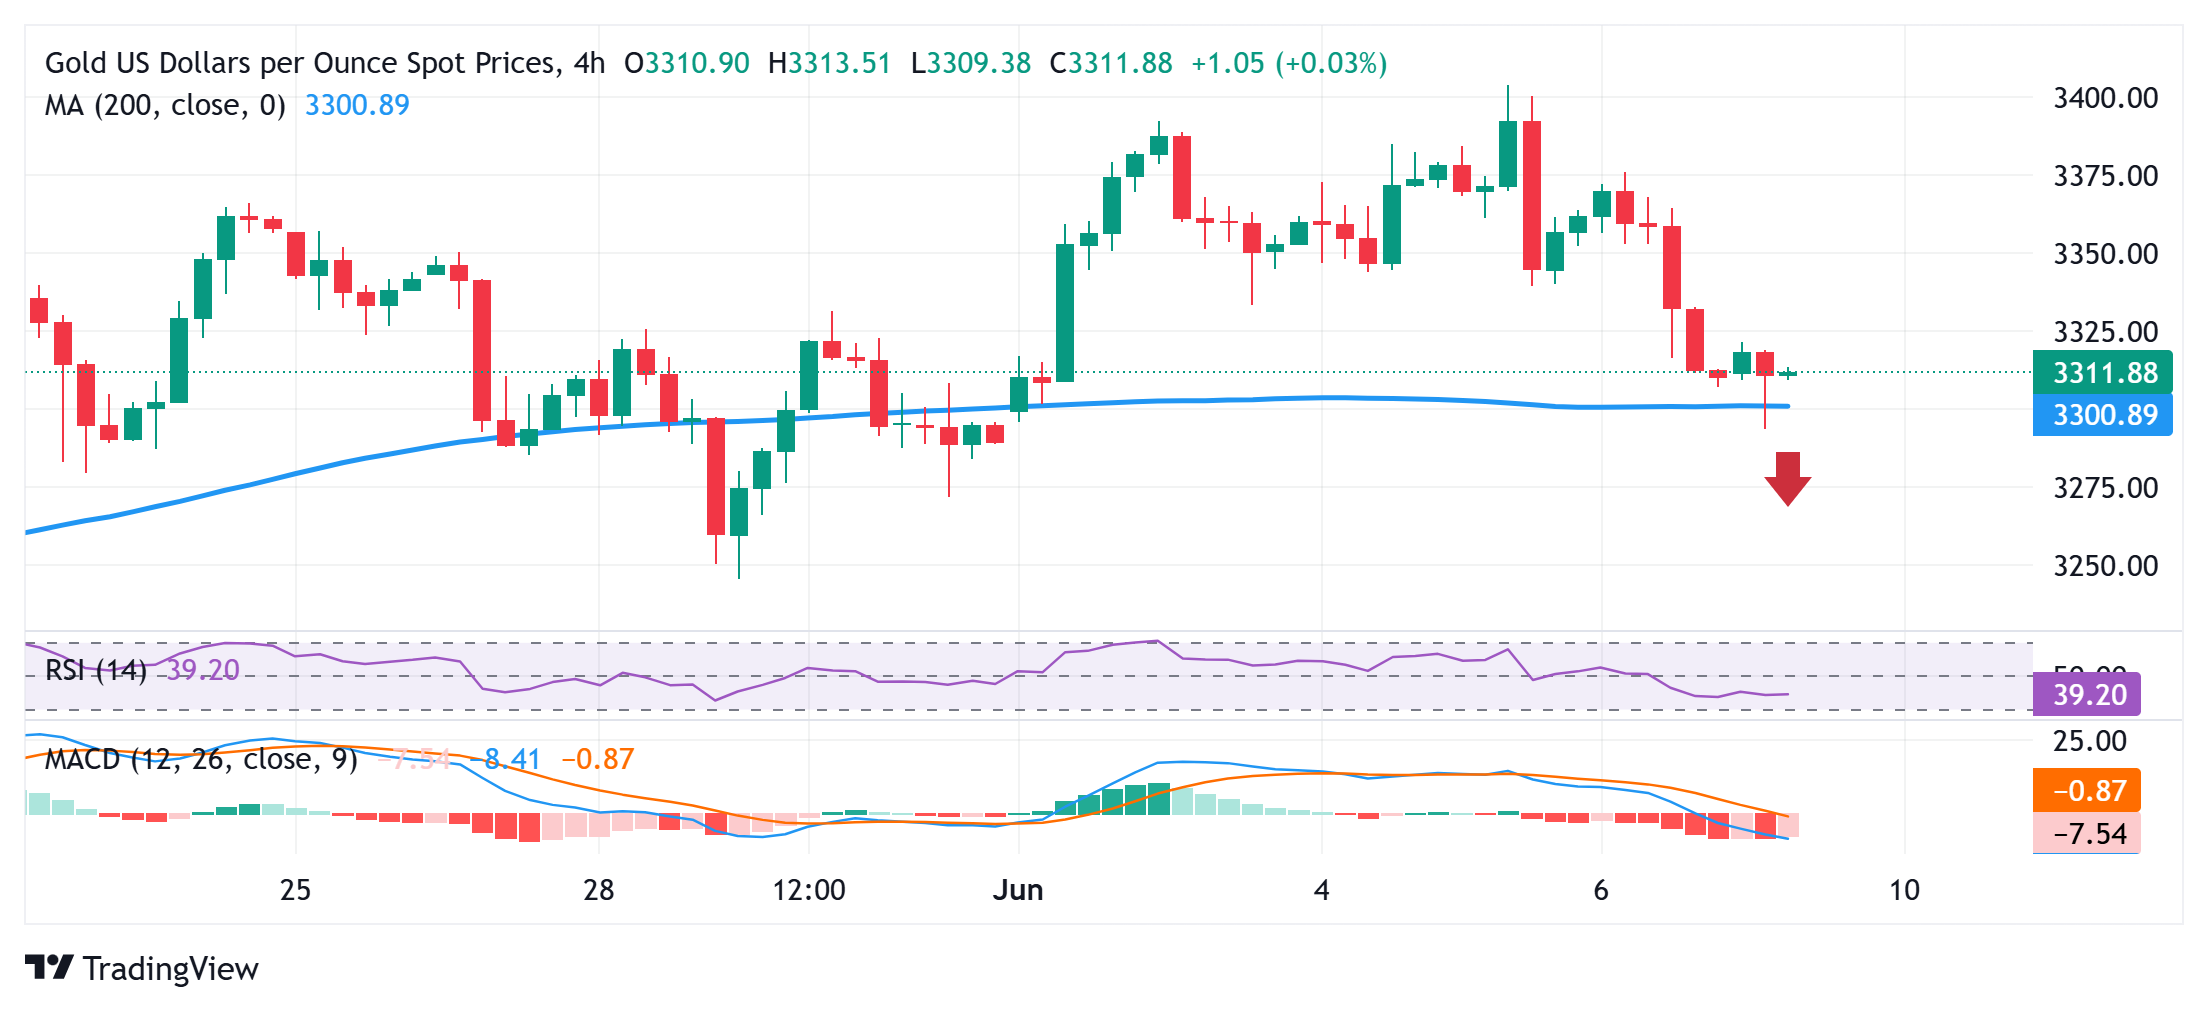
From a technical perspective, the Gold price showed an intraday resilience below the $3,300 mark and the 200-period Simple Moving Average (SMA) on the 4-hour chart. This makes it prudent to wait for acceptance below the said handle before positioning for deeper losses. The XAU/USD pair might then accelerate the slide below the $3,283-3,282 region, towards the $3,246-3,245 area (May 29 swing low) en route to the $3,200 neighborhood.
On the flip side, any meaningful move higher is likely to confront a stiff barrier and attract fresh sellers near the $3.352-3,353 horizontal zone. This, in turn, should cap the Gold price near the $3,377-3,378 resistance. A sustained strength beyond the latter, however, could trigger a short-covering rally and allow the XAU/USD bulls to make a fresh attempt to conquer the $3,400 round figure. The momentum could extend further towards the $3,425-3,430 region en route to the all-time top, around the $3,500 psychological mark touched in April.
US Dollar PRICE Today
The table below shows the percentage change of US Dollar (USD) against listed major currencies today. US Dollar was the strongest against the Canadian Dollar.
| USD | EUR | GBP | JPY | CAD | AUD | NZD | CHF | |
|---|---|---|---|---|---|---|---|---|
| USD | -0.27% | -0.31% | -0.52% | -0.13% | -0.46% | -0.66% | -0.18% | |
| EUR | 0.27% | -0.05% | -0.26% | 0.13% | -0.18% | -0.40% | 0.08% | |
| GBP | 0.31% | 0.05% | -0.12% | 0.19% | -0.12% | -0.35% | 0.14% | |
| JPY | 0.52% | 0.26% | 0.12% | 0.40% | 0.00% | -0.21% | 0.22% | |
| CAD | 0.13% | -0.13% | -0.19% | -0.40% | -0.36% | -0.54% | -0.06% | |
| AUD | 0.46% | 0.18% | 0.12% | -0.00% | 0.36% | -0.23% | 0.26% | |
| NZD | 0.66% | 0.40% | 0.35% | 0.21% | 0.54% | 0.23% | 0.49% | |
| CHF | 0.18% | -0.08% | -0.14% | -0.22% | 0.06% | -0.26% | -0.49% |
The heat map shows percentage changes of major currencies against each other. The base currency is picked from the left column, while the quote currency is picked from the top row. For example, if you pick the US Dollar from the left column and move along the horizontal line to the Japanese Yen, the percentage change displayed in the box will represent USD (base)/JPY (quote).
Author

Haresh Menghani
FXStreet
Haresh Menghani is a detail-oriented professional with 10+ years of extensive experience in analysing the global financial markets.


