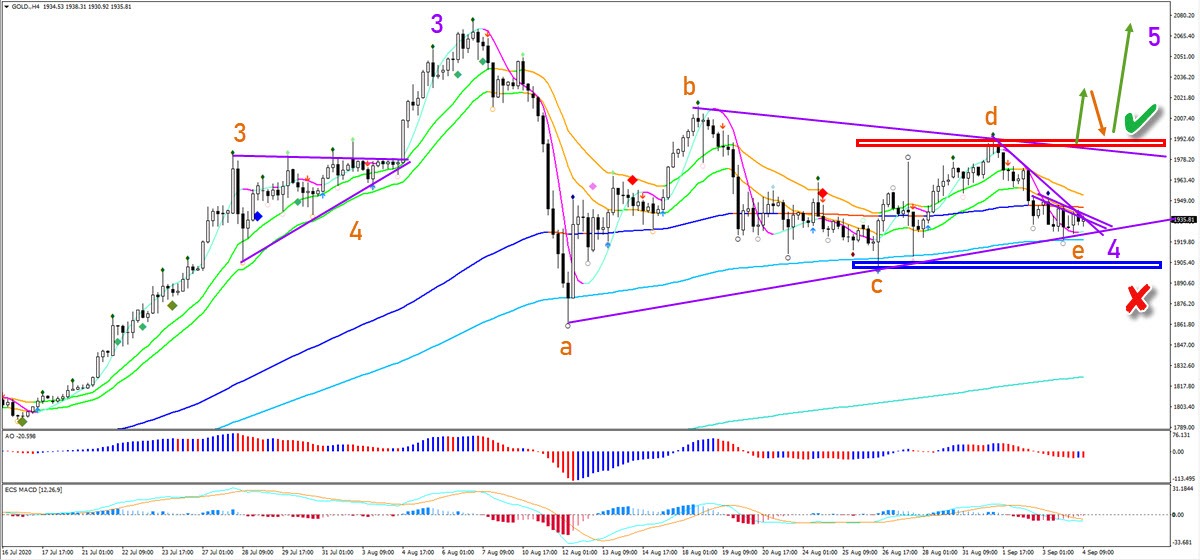
Gold Price News and Forecast: XAU/USD triangle pattern completing final wave E pattern


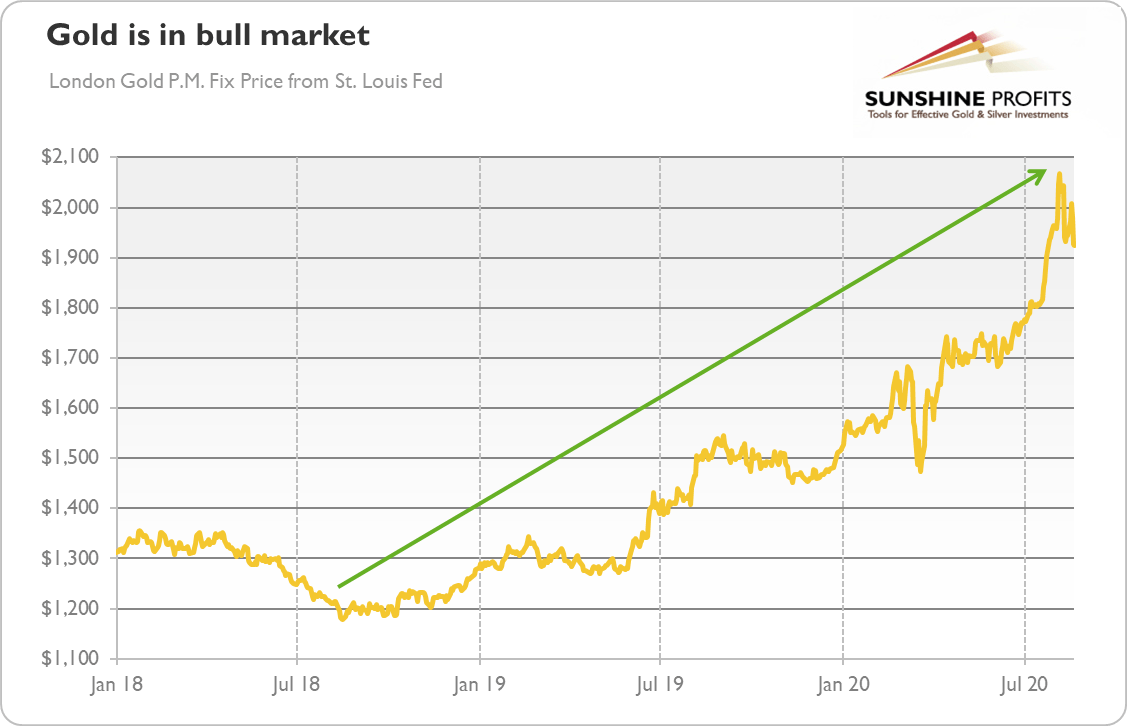
Gold bull markets: History and prospects ahead

Would you like to know one simple way of achieving investment successes and getting rich? That’s great, I will reveal this secret to you – and you even don’t have to click anything! The trick is to find a bull market and go long! And, what a coincidence, gold is right now in the bull market… If you don’t believe, then look at the chart below.

If the chart does not present the bull market then I have no idea either what it presents or what is the bull market. As you can see, gold gained about $800, or two thirds, since the autumn of 2018, which seems to be quite bullish! Read More...

Chart

Gold triangle pattern completing final wave E pattern

Gold (XAU/USD) is confirming a contracting triangle chart pattern. This price pattern was expected in our analysis after price action strongly dropped within a large and established uptrend. Is the triangle now close to being completed?

The XAU/USD is now testing the bottom of wave C (blue box). This is a critical and interesting point of any potential triangle pattern. The reason is simple: price is close to either confirming (green check) or invalidating (red x) this wave pattern. The retest of the previous bottoms could be a final wave E (orange) and indicate the end of the triangle pattern. This would also complete wave 4 (purple). Read More...

Gold

Gold: A break above 1961 is a short term buy signal

Gold Spot broke below 1942 for a short term sell signal targeting 1937, 1931 & our buying opportunity at 1924/22. This trade worked perfectly as we bottomed exactly here & shot higher to 1941.

Silver Spot longs at 2725/15 worked perfectly as we shot higher to the target of 2760/70 & topped exactly here. However we reversed & broke 2725/15 for our sell signal targeting 2650/40 & bottomed exactly here.

Gold meets first resistance at 1947 for some profit taking on any remaining longs. Sell at 1950/55 with stops above 1961. A break higher is a short term buy signal targeting 1970/72 & perhaps as far as strong resistance at 1983/86. Shorts need stops above 1991. Read More...

Gold

Share: Feed news

Information on these pages contains forward-looking statements that involve risks and uncertainties. Markets and instruments profiled on this page are for informational purposes only and should not in any way come across as a recommendation to buy or sell in these assets. You should do your own thorough research before making any investment decisions. FXStreet does not in any way guarantee that this information is free from mistakes, errors, or material misstatements. It also does not guarantee that this information is of a timely nature. Investing in Open Markets involves a great deal of risk, including the loss of all or a portion of your investment, as well as emotional distress. All risks, losses and costs associated with investing, including total loss of principal, are your responsibility. The views and opinions expressed in this article are those of the authors and do not necessarily reflect the official policy or position of FXStreet nor its advertisers. The author will not be held responsible for information that is found at the end of links posted on this page.

If not otherwise explicitly mentioned in the body of the article, at the time of writing, the author has no position in any stock mentioned in this article and no business relationship with any company mentioned. The author has not received compensation for writing this article, other than from FXStreet.

FXStreet and the author do not provide personalized recommendations. The author makes no representations as to the accuracy, completeness, or suitability of this information. FXStreet and the author will not be liable for any errors, omissions or any losses, injuries or damages arising from this information and its display or use. Errors and omissions excepted.

The author and FXStreet are not registered investment advisors and nothing in this article is intended to be investment advice.

Recommended content


Recommended content

Editors’ Picks

AUD/USD failed just ahead of the 200-day SMA

AUD/USD failed just ahead of the 200-day SMA

Finally, AUD/USD managed to break above the 0.6500 barrier on Wednesday, extending the weekly recovery, although its advance faltered just ahead of the 0.6530 region, where the key 200-day SMA sits.

AUD/USD News

EUR/USD met some decent resistance above 1.0700

EUR/USD met some decent resistance above 1.0700

EUR/USD remained unable to gather extra upside traction and surpass the 1.0700 hurdle in a convincing fashion on Wednesday, instead giving away part of the weekly gains against the backdrop of a decent bounce in the Dollar.

EUR/USD News

Gold keeps consolidating ahead of US first-tier figures

Gold keeps consolidating ahead of US first-tier figures

Gold finds it difficult to stage a rebound midweek following Monday's sharp decline but manages to hold above $2,300. The benchmark 10-year US Treasury bond yield stays in the green above 4.6% after US data, not allowing the pair to turn north.

Gold News

Bitcoin price could be primed for correction as bearish activity grows near $66K area

Bitcoin price could be primed for correction as bearish activity grows near $66K area

Bitcoin (BTC) price managed to maintain a northbound trajectory after the April 20 halving, despite bold assertions by analysts that the event would be a “sell the news” situation. However, after four days of strength, the tables could be turning as a dark cloud now hovers above BTC price.

Read more

Bank of Japan's predicament: The BOJ is trapped

Bank of Japan's predicament: The BOJ is trapped

In this special edition of TradeGATEHub Live Trading, we're joined by guest speaker Tavi @TaviCosta, who shares his insights on the Bank of Japan's current predicament, stating, 'The BOJ is Trapped.' 

Read more

Forex MAJORS

Cryptocurrencies

Signatures