Gold bull markets: History and prospects ahead

Would you like to know one simple way of achieving investment successes and getting rich? That’s great, I will reveal this secret to you – and you even don’t have to click anything! The trick is to find a bull market and go long! And, what a coincidence, gold is right now in the bull market… If you don’t believe, then look at the chart below.
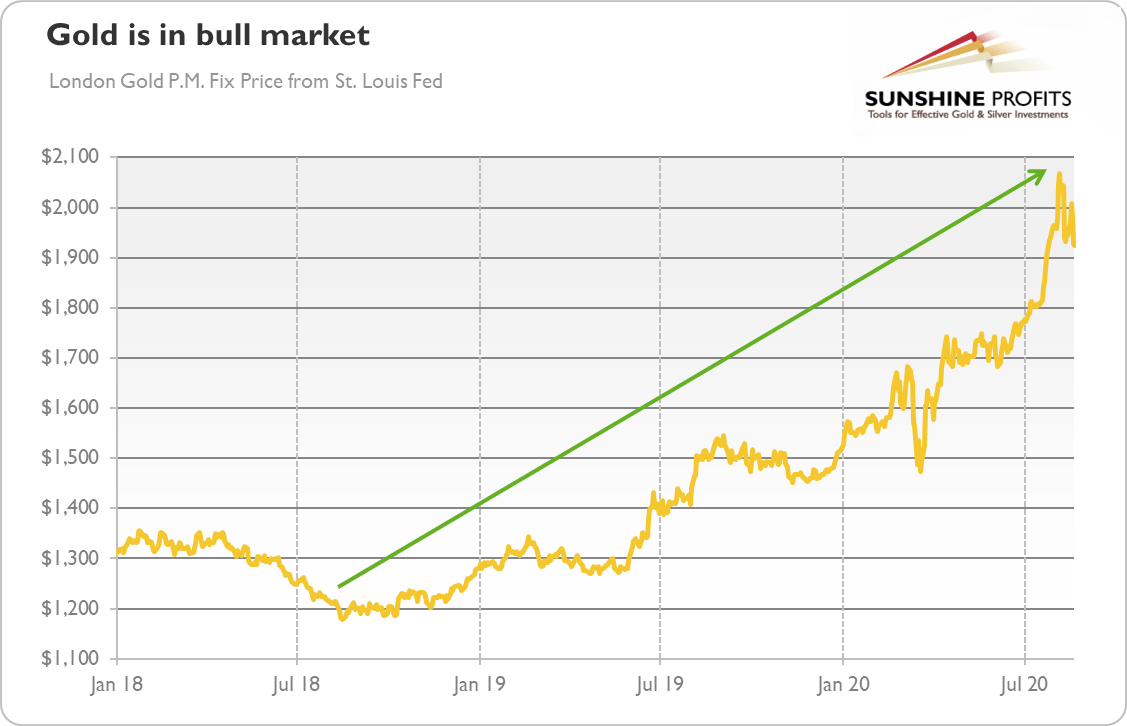
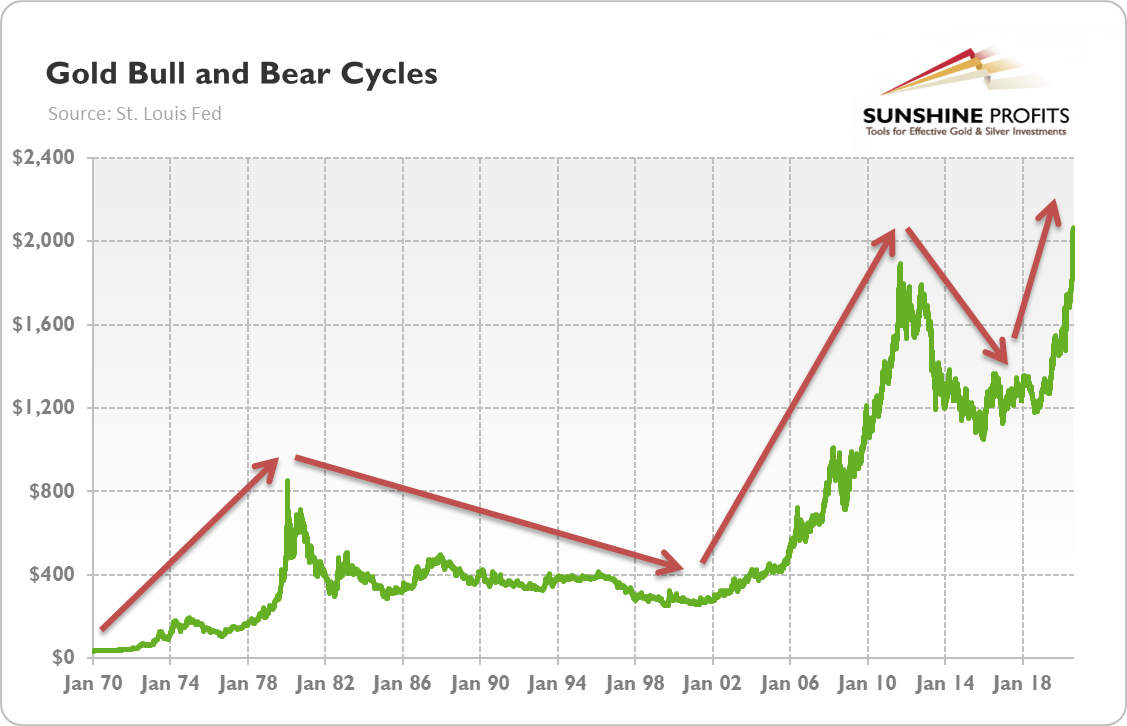
If the chart does not present the bull market then I have no idea either what it presents or what is the bull market. As you can see, gold gained about $800, or two thirds, since the autumn of 2018, which seems to be quite bullish!
Of course, you can argue that the bull market started earlier, in December 2015, when the price of the yellow metal reached the bottom of $1,049, as the chart below shows. You would be theoretically right, but from the practical point of view, gold entered a sideways trend until late 2018, and since then (and since surpassing the upside barrier of $1,400 in mid-2019) the trend has been clearly rising.
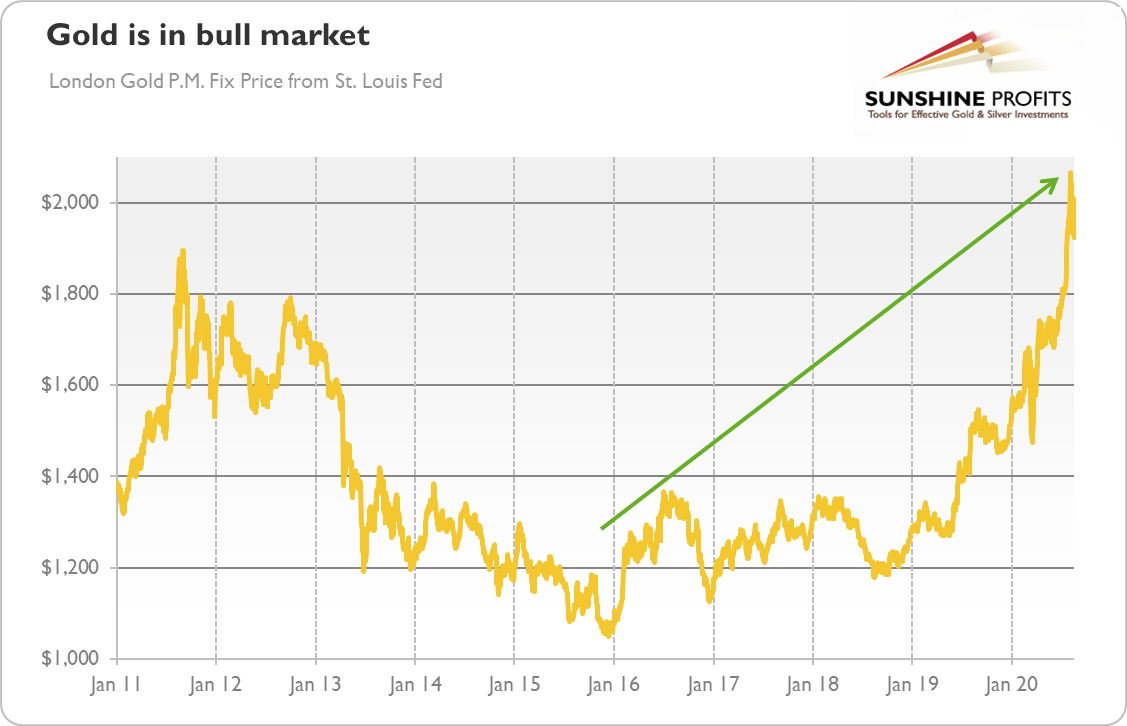
And in July 2020, the price of gold has surpassed its previous record high, strengthening the bullish case for gold. Now, the question is not whether we are in the bull market, but what will this bull market be like, how long is it going to last, and what level will gold reach?
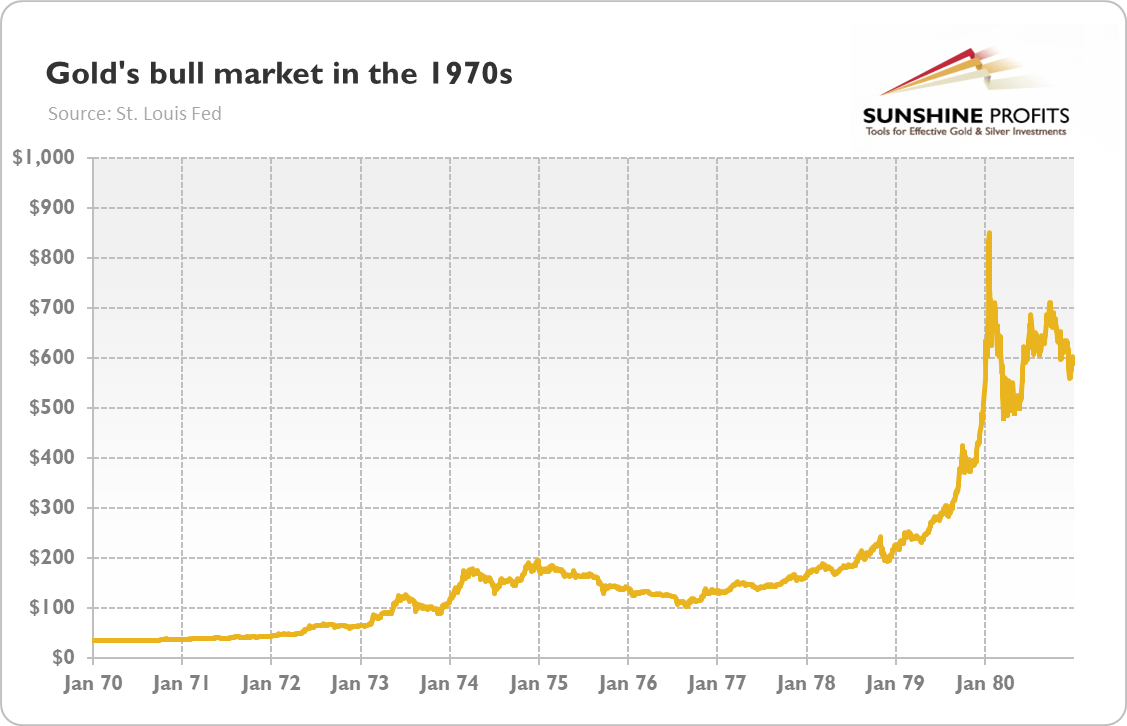
Although the sample is terribly small, it’s always good to look at previous bull markets in gold. The first one occurred in the 1970s, when President Nixon ended the gold standard, while fiscal deficits and inflation moved out of control. In consequence, as one can see in the chart below, the price of gold skyrocketed from about $35 to $850, or more than 2,300 percent!
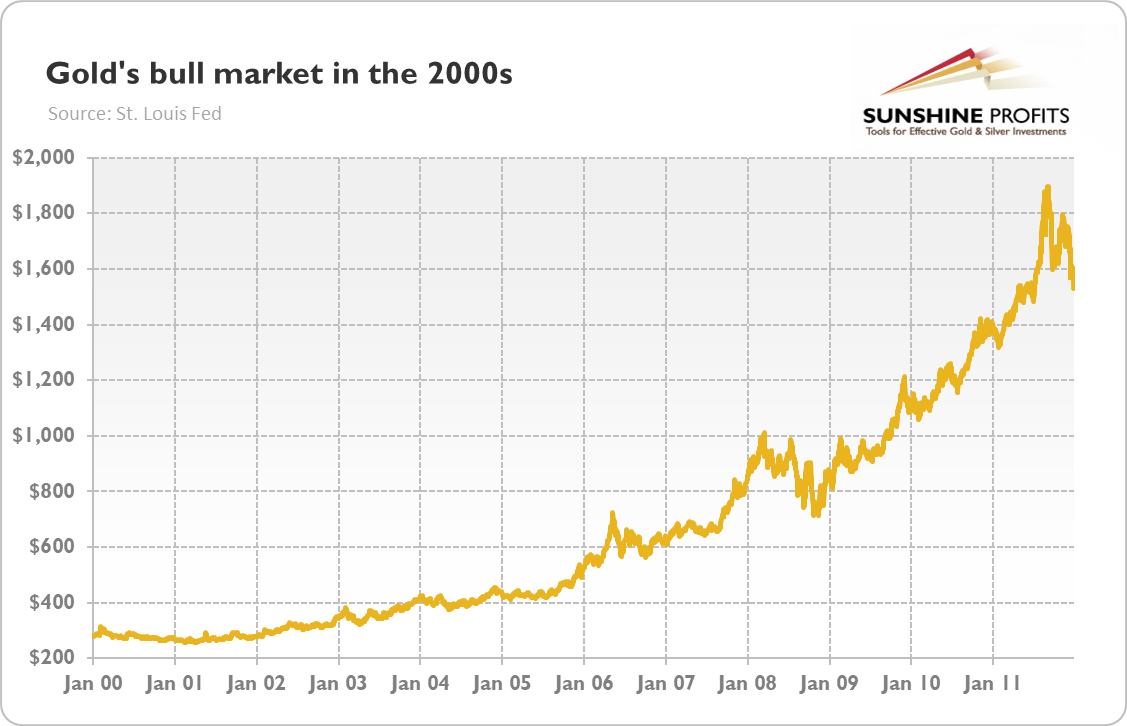
The second gold’s bull market happened in the 2000s, when President Bush’s policies weakened the U.S. dollar, while the Great Recession and the introduced quantitative easing in response scarred investors and spurred inflation expectations. As the chart below shows, the price of gold soared from about $255 to $1,895, or more than 640 percent!
What does this brief analysis imply for gold? Well, so far gold gained about 85 percent since the bottom, so there is room for further gains. Of course, it’s highly unlikely that gold will skyrocket as strongly as in the 1970s, because its price was much lower and the current international monetary system was in its infancy after the end of the Breton Woods and the closure of the gold window. Neither the gains similar to those from the 2000s are probable, as the unconventional monetary policy with quantitative easing has become totally conventional monetary policy, which does not trigger such worries as back then.
But there is definitely more upside potential for gold. Remember that previous bull markets lasted for a decade each. Even if we accept December 2015, instead of late 2018, as the starting point of the current bull market, there are still a few bullish years ahead of us.
What else can we learn from the previous bull markets? First, let’s take a look at the charts above once again. As you can see, gold started timidly each time, then it accelerated, just to soar at the very end of each phase of the bull market. If history repeats, we are in a correction period and gold will not rally further unless it consolidates somewhat.
And this is another lesson: bull markets are never linear, but they consist of ups and downs, as the recent correction clearly shows. Just as the gold market in general, as the chart below presents.
Second, there are many similarities between previous bull markets and the current one. In particular, the fiscal policy is lax and budget deficits are ballooning, while the money supply is soaring. The Fed’s balance sheet skyrocketed. The only component of former gold’s bull markets we lack, is the secular bear market in the U.S. dollar. But given the massive government spending, high level of federal debt, and the policy of zero interest rates, this can change at some point, if it hasn't changed already…
Third, the new decade we are entering, could be more similar to the 1970s than to the 2000s. We mean here the fact that the current economic crisis is already less deflationary and more inflationary than the global financial crisis. Inflation is low, but it is positive. Meanwhile, interest rates are below the inflation rate, which implies negative real interest rates, the rocket fuel for gold.
Want free follow-ups to the above article and details not available to 99%+ investors? Sign up to our free newsletter today!
Want free follow-ups to the above article and details not available to 99%+ investors? Sign up to our free newsletter today!
Author

Arkadiusz Sieroń
Gold Price Forecast
Arkadiusz Sieroń received his Ph.D. in economics in 2016 (his doctoral thesis was about Cantillon effects), and has been an assistant professor at the Institute of Economic Sciences at the University of Wrocław since 2017.


