Gold price keeps the red near 100-day SMA despite modest USD weakness
- Gold price attracts some follow-through selling for the second successive day on Monday.
- The Fed’s hawkish shift remains supportive of elevated US bond yields and exerts pressure.
- Geopolitical risks and trade war fears could offer some support to the safe-haven XAU/USD.

Gold price (XAU/USD) turns lower for the second straight day following an intraday uptick to the $2,647-2,648 area on Monday and moves further away from a nearly three-week high touched on Friday. The Federal Reserve's (Fed) hawkish signal that it would slow the pace of interest rate cuts in 2025 remains supportive of elevated US Treasury bond yields and turns out to be a key factor driving flows away from the non-yielding yellow metal. Apart from this, a generally positive risk tone contributes to the offered tone surrounding the safe-haven precious metal.
Meanwhile, the ongoing US Dollar (USD) pullback from its highest level since November 2022 touched last Thursday, along with geopolitical risks and trade war fears, could help limit losses for the Gold price. Traders might also refrain from placing aggressive directional bets ahead of this week's important US macro releases, including the Nonfarm Payrolls (NFP) report on Friday. Apart from this, the December FOMC meeting minutes on Wednesday will play a key role in influencing the near-term USD price dynamics and provide some meaningful impetus to the XAU/USD.
Gold price struggles to lure buyers as Fed's hawkish shift overshadows modest USD weakness
- The Institute of Supply Management (ISM) reported on Friday that the US Manufacturing PMI improved from 48.4 to 49.3 in December, pointing to signs of resilience and potential for growth.
- This comes on top of the prospects for a slower pace of rate cuts by the Federal Reserve in 2025 and remains supportive of elevated US Treasury bond yields, undermining the Gold price.
- The yield on the benchmark 10-year US government bond reached its highest point since May 2 and assists the US Dollar in holding steady just below a two-year high touched last Thursday.
- San Francisco Fed President Mary Daly said on Saturday that despite significant progress in lowering price pressures over the past two years, inflation remains uncomfortably above the 2% target.
- Investors this week will confront the release of important US macro releases, including the closely-watched Nonfarm Payrolls report on Friday, ahead of the next Fed meeting later this month.
- Israeli forces continued to attack medical facilities in the Gaza Strip and more Israeli raids were reported in the occupied West Bank on Sunday, while the Houthis have intensified their attacks on Israel.
- Ukraine said on Sunday that it had carried out surprise attacks against Russian forces in several areas in Kursk. The Russian Defence Ministry also confirmed the Ukrainian counterattacks.
Gold price bears await break and acceptance below the 100-day SMA before placing fresh bets
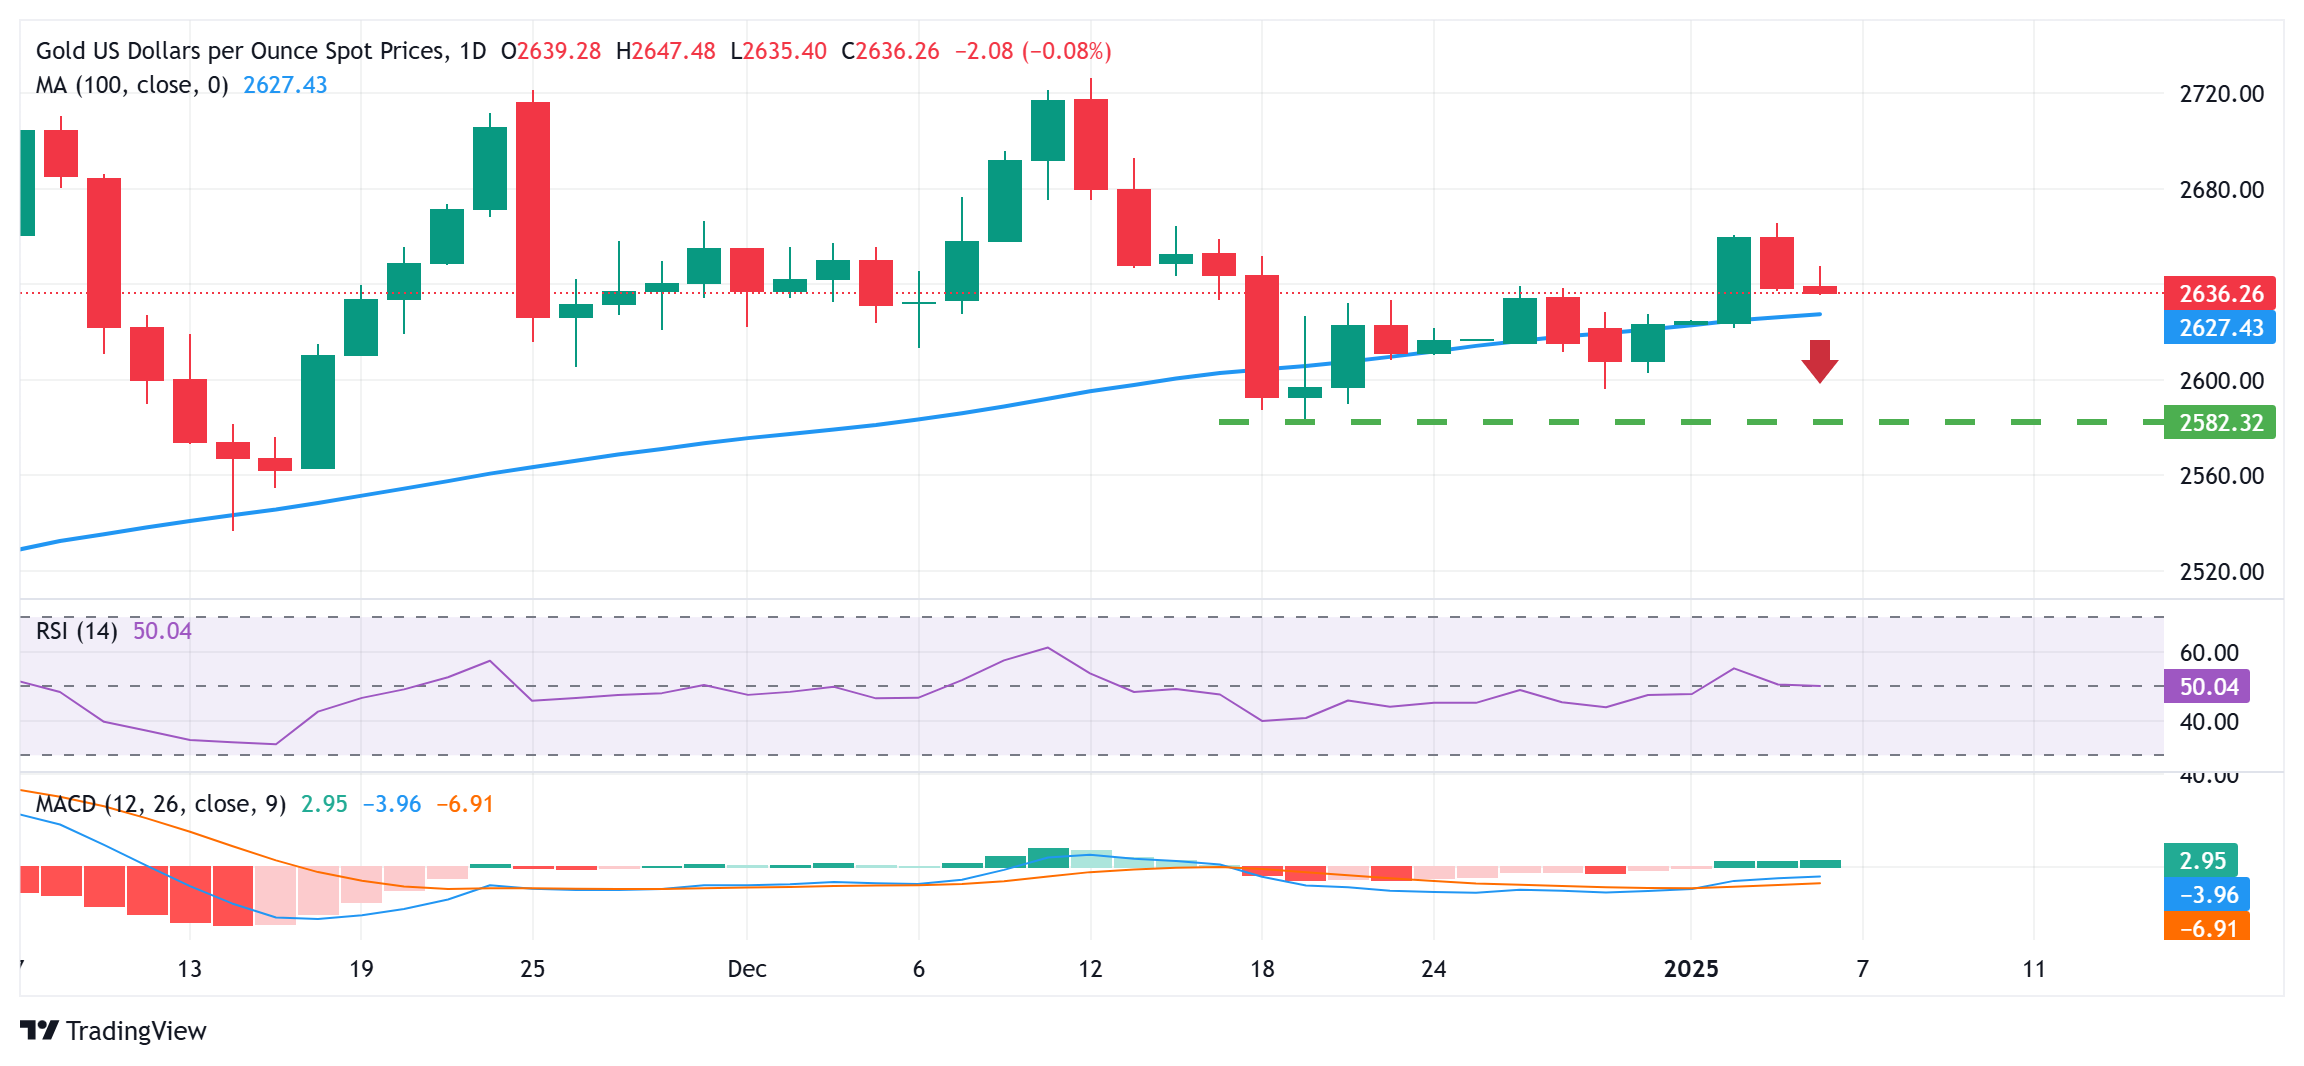
From a technical perspective, any subsequent slide is likely to find decent support near the 100-day Simple Moving Average (SMA), currently pegged near the $2,625 region. This is followed by the $2,600 mark, below which the Gold price could drop to the December monthly swing low, around the $2,583 area. Some follow-through selling will be seen as a fresh trigger for bearish traders and pave the way for deeper losses.
On the flip side, momentum beyond the Asian session high, around the $2,647 region, could lift the Gold price back to the $2,665 area, or the multi-week high. The subsequent move up could extend further towards an intermediate resistance near the $2,681-2,683 zone en route to the $2,700 mark. The latter should act as a pivotal point, which if cleared decisively will set the stage for an extension of a two-week-old uptrend.
US Dollar PRICE Today
The table below shows the percentage change of US Dollar (USD) against listed major currencies today. US Dollar was the strongest against the Japanese Yen.
| USD | EUR | GBP | JPY | CAD | AUD | NZD | CHF | |
|---|---|---|---|---|---|---|---|---|
| USD | -0.32% | -0.41% | 0.35% | -0.57% | -0.47% | -0.41% | -0.35% | |
| EUR | 0.32% | -0.10% | 0.64% | -0.19% | -0.11% | -0.05% | 0.01% | |
| GBP | 0.41% | 0.10% | 0.75% | -0.10% | -0.01% | 0.05% | 0.10% | |
| JPY | -0.35% | -0.64% | -0.75% | -0.91% | -0.79% | -0.71% | -0.46% | |
| CAD | 0.57% | 0.19% | 0.10% | 0.91% | 0.03% | 0.12% | 0.20% | |
| AUD | 0.47% | 0.11% | 0.00% | 0.79% | -0.03% | 0.06% | 0.11% | |
| NZD | 0.41% | 0.05% | -0.05% | 0.71% | -0.12% | -0.06% | 0.05% | |
| CHF | 0.35% | -0.01% | -0.10% | 0.46% | -0.20% | -0.11% | -0.05% |
The heat map shows percentage changes of major currencies against each other. The base currency is picked from the left column, while the quote currency is picked from the top row. For example, if you pick the US Dollar from the left column and move along the horizontal line to the Japanese Yen, the percentage change displayed in the box will represent USD (base)/JPY (quote).
Author

Haresh Menghani
FXStreet
Haresh Menghani is a detail-oriented professional with 10+ years of extensive experience in analysing the global financial markets.


