Gold Price Forecast: XAUUSD traders appear tight-lipped around $1,770 – Confluence Detector
- Gold price remains mildly offered near three-month high, retreats of late.
- Mixed sentiment keeps XAUUSD buyers hopeful but steady yields and the US Dollar tease sellers.
- Multiple hurdles challenge gold traders between the $1,767 and $1,774 area as buyers run out of steam.

Gold price (XAUUSD) portrays the buyer’s exhaustion around $1,770, printing mild losses after a lackluster start to the week, as traders seek more clues to welcome the bears. Even so, comments suggesting inflation fears from the Federal Reserve (Fed) officials and downbeat statistics from China weigh on the metal prices. On the same line could be the global ire over Russia’s invasion of Ukraine at the Group of 20 Nations (G20) meeting in Indonesia. Furthermore, the Covid woes and recently firmer US Treasury yields also keep the XAUUSD bears hopeful as markets brace for the key US Producer Price Index (PPI) and Retail Sales for October.
Gold Price: Key levels to watch
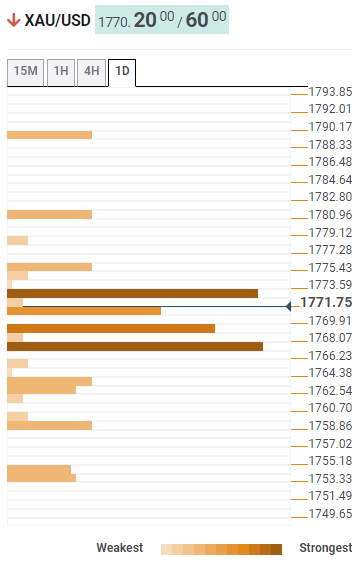
The Technical Confluence Detector shows that the gold price is clubbed inside a $7 range between $1,767 and $1,774 as bulls take a breather after posting the biggest weekly gains since March 2020.
That said, a convergence of the previous high on the four-hour and Pivot Point R2 on the monthly frame restricts the quote’s immediate upside.
Following that, the previous daily high near $1,776 and Pivot Point 1-Day R1 could challenge the buyers near $1,781 ahead of highlighting the $1,790 hurdle comprising the Pivot Point 1-Day R2
Alternatively, the previous weekly high and SMA5 on 4H joins the middle Bollinger on the one-hour to highlight $1,768 as immediate key support before 38.2% Fibonacci retracement of one-day, SMA10 4H and previous low on 4H, around $1,767.
Should the XAUUSD bears break $1,767 support, 61.8% Fibonacci retracement level on the daily formation, around $1,762 will precede the Pivot Point 1-day S1 and the previous bottom on the daily chart, respectively near $1,758 and $1,753, to entertain the gold sellers.
Here is how it looks on the tool
About Technical Confluences Detector
The TCD (Technical Confluences Detector) is a tool to locate and point out those price levels where there is a congestion of indicators, moving averages, Fibonacci levels, Pivot Points, etc. If you are a short-term trader, you will find entry points for counter-trend strategies and hunt a few points at a time. If you are a medium-to-long-term trader, this tool will allow you to know in advance the price levels where a medium-to-long-term trend may stop and rest, where to unwind positions, or where to increase your position size.
Author

Anil Panchal
FXStreet
Anil Panchal has nearly 15 years of experience in tracking financial markets. With a keen interest in macroeconomics, Anil aptly tracks global news/updates and stays well-informed about the global financial moves and their implications.

















