Gold Price Forecast: XAUUSD tests a key area of weekly demand, a correction could be nigh
- Gold Price rallied to fresh session highs at $1895 in wake of weak US GDP data.
- But XAU/USD has since dropped back into the mid-$1880s, as the buck and US yields remain buoyant.
- Bulls are moving in at a key area of support as per the weekly chart.

Gold Price, at $1,890, is 0.20% higher at the time of writing and has traded between a range of $1,872.21/$1,895.44 on the day so far as the bulls step in during the North American session while the US dollar is faded across the G10s from the highest levels in 20-years. The DXY, an index that measures the greenback vs. a basket of currencies made a high of 103.92 on Thursday.
The catalyst for the move in forex came in the divergence between the Federal Reserve and the Bank of Japan, with the yen tumbling to its lowest since 2002 after the Bank of Japan doubled down on its ultra-loose monetary policy. The yen dropped to a 20-year low and breached the 131 per dollar level after the Bank of Japan vowed to buy unlimited amounts of 10-year bonds daily to defend its yield target. The yen was last at 131.11 per dollar. The stronger dollar kept gold prices under pressure.
Additionally, US government bonds rose after signs of strength in the US job market outweighed an expected decline in economic growth in the first quarter. Investors therefore still expect that US rates will continue to rise and that next week's Federal Reserve meeting will bring the first of several consecutive 50-basis-point hikes.
Markets React To Weak US GDP Figures
US yields continue to advance in wake of the latest weak GDP growth data, perhaps given the inflation readings released alongside the GDP numbers were stronger than forecast (the GDP Price Index jumped to 8.0% YoY in Q1 from 7.1% in Q4). Markets seem, for now, to have remained confident in the story that the Fed will rapidly raise interest rates in the coming months to get them back to neutral (around 2.5%) by the year's end.
That may keep US yields and the US dollar underpinned for now, which may make a recovery in XAU/USD back above $1900 a challenge. But if the US economy does fall into recession at the start of 2022 (two consecutive quarters of negative growth are classed as a recession), then that man deter the Fed from lifting interest rates substantially above the so-called neutral rate of 2.5%.
If the Fed does become increasingly concerned about growth and less willing to tighten to combat inflation, this could be a positive for gold in the long-run. For now, though, the buck's bull run looks unstoppable, suggesting now isn't the time to start betting on a rebound in gold just yet. When the dollar appreciates, it makes USD-denominated commodities more expensive for international buyers, thus reducing demand.
''The outlook for investment demand also remains muted, with gold bugs staring down the barrel of a hawkish Fed, while safe-haven flows associated with the war in Ukraine begin to fizzle out,'' analysts at TD Securities argued.
However, the technical outlook could be starting to paint a different story.
Gold technical analysis
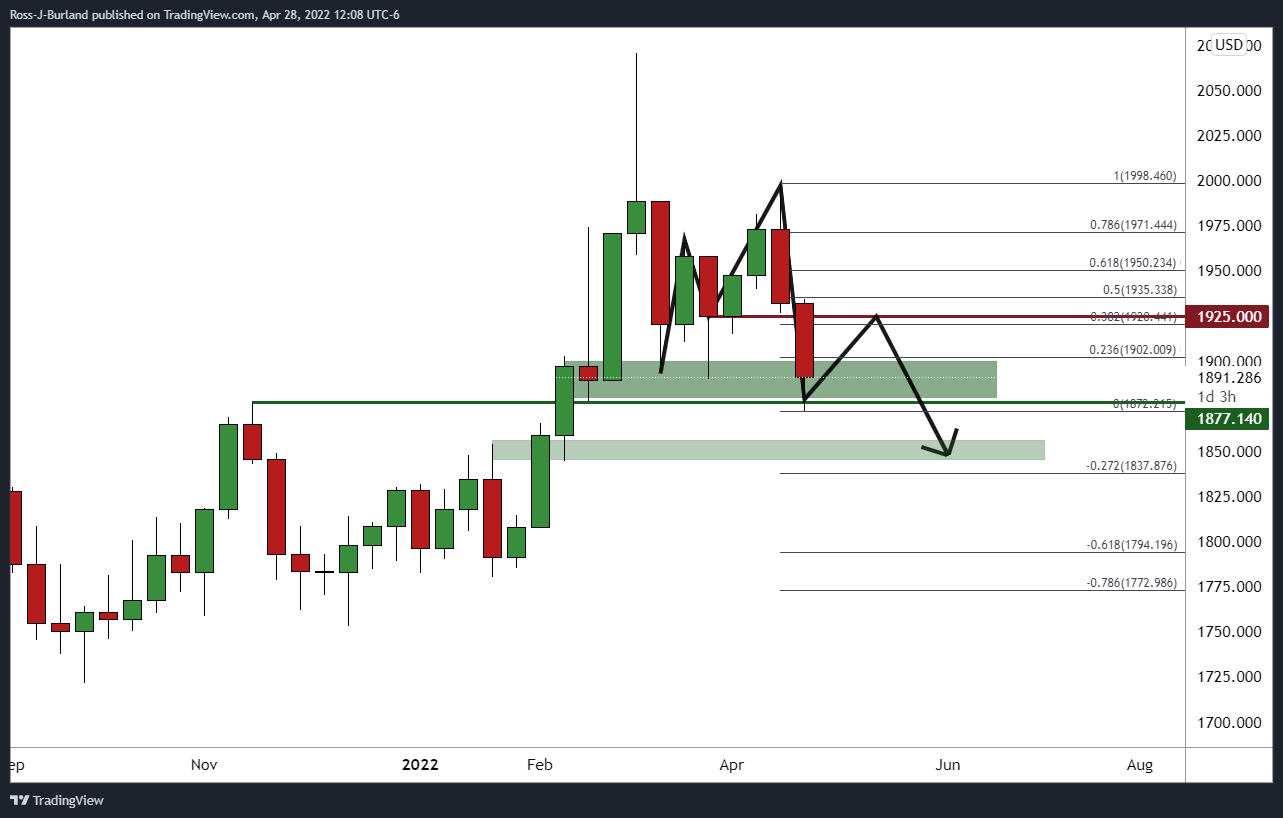
From a weekly perspective, the price has carved out an M-formation. This is a reversion pattern, and while potentially still premature in its evolution, it is one nonetheless. Should the current support area hold, the neckline could draw in the bulls where it has a confluence with the 38.2% Fibonacci retracement of the bearish weekly impulse near $1,925. In doing so, this could then accumulate enough liquidity for the bears to move in again and see to a downside extension towards the next layer of presumed support around $1,850.
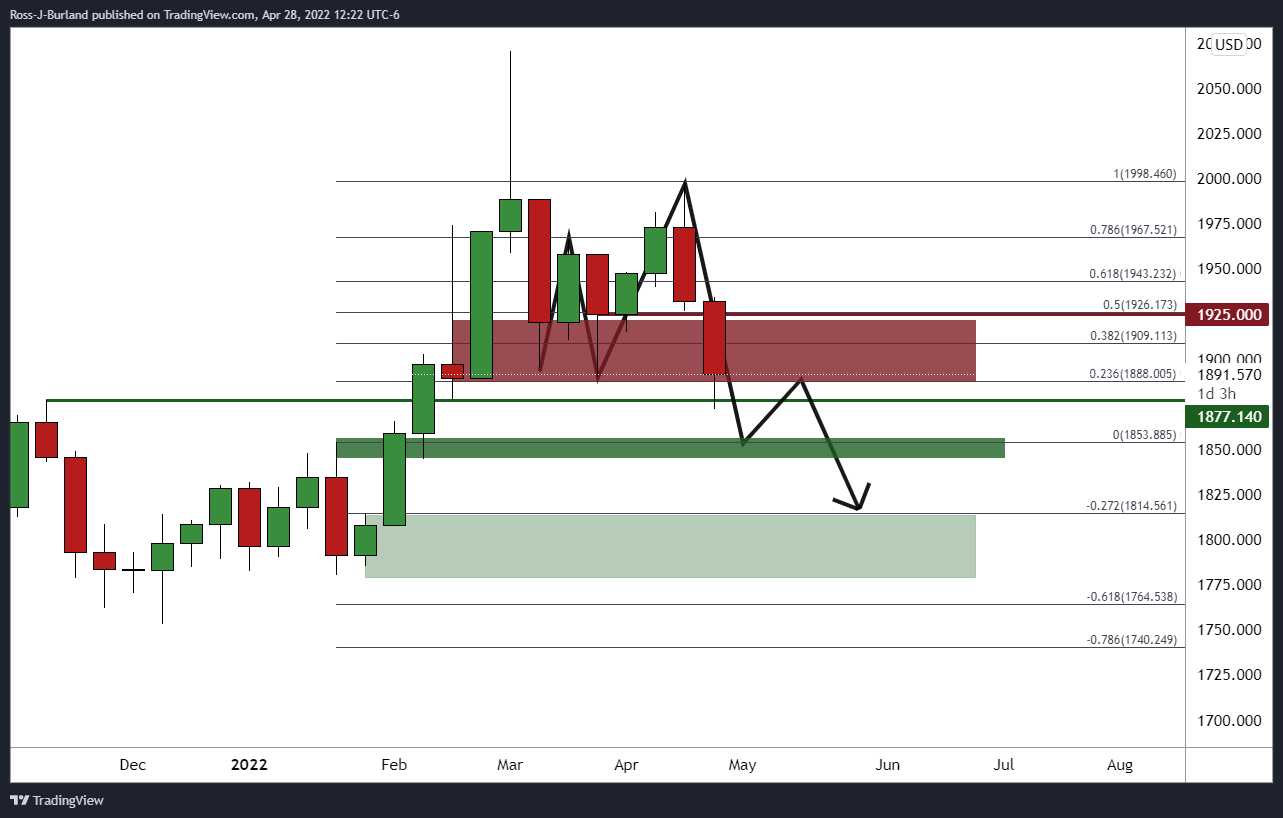
On the other hand, if this support does give out, then the $1,850 will come a lot sooner and we will be looking at a bigger M-formation as follows:
Author

Sagar Dua
FXStreet
Sagar Dua is associated with the financial markets from his college days. Along with pursuing post-graduation in Commerce in 2014, he started his markets training with chart analysis.


