Gold Price Forecast: XAU/USD within $1,890–1930 range, US data eyed – Confluence Detector
- Gold Price remains within a $40.00 trading range inside the key technical level envelope.
- US Dollar struggles to gain acceptance ahead of US NFP, despite upbeat early signals of employment data.
- China news, pause in yields limit prod Gold sellers amid pre-data anxiety.
- Hawkish Fed bets, risk aversion keep XAU/USD bears hopeful.

Gold Price (XAU/USD) stays on the way to posting the fourth consecutive weekly loss despite being defensive at around $1,900 of late. That said, the cautious mood ahead of the top-tier US employment and inflation clues could be linked to the XAU/USD’s latest inaction/consolidation. Also acting as a trading filter for the Gold Price are the headlines from China which fade the worries tone of late.
However, the hawkish Federal Reserve (Fed) bets and concerns about the outflow of funds from markets in China to the neighboring nations, mainly due to the fresh fears surrounding the dragon nation’s housing market. Furthermore, fears of slowing economic growth in one of the world’s biggest Gold consumers, namely China, also weigh on the XAU/USD.
It’s worth noting that concerns about the Fed’s policy pivot and physical demand from Asia allow the World Gold Council (WGC) to remain optimistic about the XAU/USD.
As a result, Friday’s US employment report for June, as well as the mid-June inflation clues, will be crucial for the Gold traders to watch.
Also read: Gold Price Forecast: XAU/USD defends $1,900 but for how long? US Nonfarm Payrolls holds the key
Gold Price: Key levels to watch
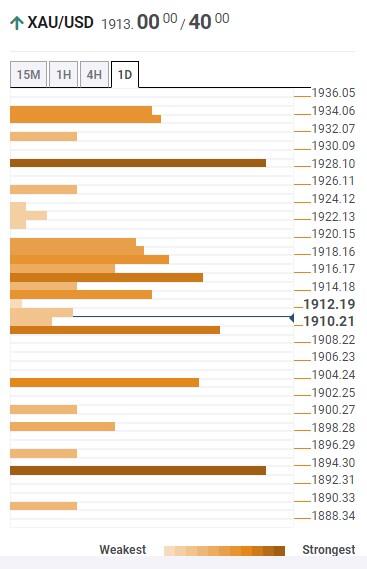
As per our Technical Confluence Indicator, the Gold Price edges higher within a $40.00 trading range, between $1,930 and $1,890, as markets brace for the top-tier US employment and inflation data.
That said, a convergence of the previous monthly and weekly low highlights the $1,892 as short-term key support for the XAU/USD traders to watch during the quote’s fresh fall.
On the flip side, Fibonacci 38.2% on one-month joins the previous daily high to highlight the $1,930 resistance confluence.
It’s worth noting that the lower band of the Bollinger on the four-hour (4H) play, the Fibonacci 38.2% on one week and 23.6% on one-day together constitute $1,908 as immediate support.
Following that, Fibonacci 23.6% on one-week, previous daily low and the lower band of the Bollinger on the one-hour can prod the Gold sellers near the $1,900 round figure before directing the bears to the $1,890 key support.
Meanwhile, the previous weekly high and upper band of the Bollinger on the 4H, near $1,935, acts as an extra filter towards the north for the Gold buyers to cross to retake control, even if they manage to piece the $1,930 hurdle.
Here is how it looks on the tool
About Technical Confluences Detector
The TCD (Technical Confluences Detector) is a tool to locate and point out those price levels where there is a congestion of indicators, moving averages, Fibonacci levels, Pivot Points, etc. If you are a short-term trader, you will find entry points for counter-trend strategies and hunt a few points at a time. If you are a medium-to-long-term trader, this tool will allow you to know in advance the price levels where a medium-to-long-term trend may stop and rest, where to unwind positions, or where to increase your position size.
Author

Anil Panchal
FXStreet
Anil Panchal has nearly 15 years of experience in tracking financial markets. With a keen interest in macroeconomics, Anil aptly tracks global news/updates and stays well-informed about the global financial moves and their implications.

















