|

Gold Price Forecast: XAU/USD turns sideways around $1,650, eyes yields action for further guidance

  • Gold price is juggling in a limited territory amid lackluster DXY.
  • The precious metal has underperformed against risk-perceived currencies amid firmer yields.
  • Solid bets for a hawkish Fed policy have kept the 10-year US yields above 4%.

Gold price (XAU/USD) is displaying back-and-forth moves after defending the downside bias below the critical support of $1,650.00. The precious metal is oscillating in a narrow range of $1,645.91-1,657.33 range in early Tokyo. Firmer risk-on sentiment in the market has failed to underpin the yellow metal.

S&P500 has delivered back-to-back bullish trading sessions as the quarterly earnings season has kicked off. Apart from that, risk-perceived currencies have also capitalized on every pullback. The US dollar index (DXY) has logged losses and is hovering around 112.00. The mighty DXY is expected to surrender the 112.00 support further.

The catalyst which is restricting a reversal in the gold prices is the firmer yields that have not surrendered their elevated levels. The 10-year US Treasury yields are holding above the critical hurdle of 4% as the odds for a 75 basis point (bps) rate hike by the Federal Reserve (Fed) are extremely solid. As per the CME FedWatch tool, chances of an increment in the interest rates by 75 bps consecutively for the fourth time stand at around 95%.

Gold technical analysis

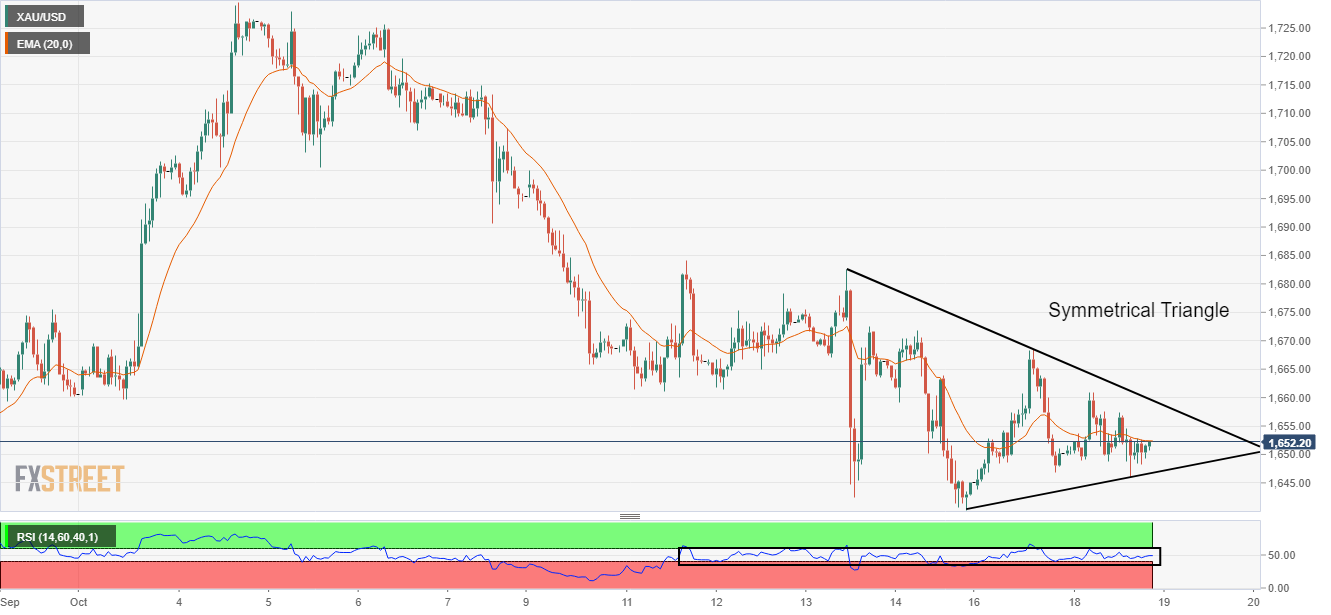
Gold prices are auctioning in a symmetrical triangle on an hourly scale as volatility has contracted amid the absence of a trigger in the economic calendar. The downward-sloping trendline is placed from Thursday’s high at $1,682.53 while the upward-sloping trendline is plotted from Friday’s low at $1,640.23.

The precious metal is overlapping with the 20-period Exponential Moving Average (EMA) at $1,652.30, which indicates a consolidation ahead.

Also, the Relative Strength Index (RSI) (14) is oscillating in a 40.00-60.00 range, which indicates the unavailability of a potential trigger.

Gold hourly chart

XAU/USD

Overview
Today last price1652.2
Today Daily Change2.10
Today Daily Change %0.13
Today daily open1650.1
 
Trends
Daily SMA201670.36
Daily SMA501708.42
Daily SMA1001748.03
Daily SMA2001817.76
 
Levels
Previous Daily High1668.53
Previous Daily Low1643.84
Previous Weekly High1699.96
Previous Weekly Low1640.23
Previous Monthly High1735.17
Previous Monthly Low1614.85
Daily Fibonacci 38.2%1659.1
Daily Fibonacci 61.8%1653.27
Daily Pivot Point S11639.78
Daily Pivot Point S21629.47
Daily Pivot Point S31615.09
Daily Pivot Point R11664.47
Daily Pivot Point R21678.85
Daily Pivot Point R31689.16

Author

Sagar Dua

Sagar Dua

FXStreet

Sagar Dua is associated with the financial markets from his college days. Along with pursuing post-graduation in Commerce in 2014, he started his markets training with chart analysis.

More from Sagar Dua
Share:

Markets move fast. We move first.

Orange Juice Newsletter brings you expert driven insights - not headlines. Every day on your inbox.

By subscribing you agree to our Terms and conditions.

Editor's Picks

EUR/USD holds steady near 1.1750 on first trading day of 2026

EUR/USD stays calm on Friday and trades in a narrow channel at around 1.1750 as trading conditions remain thin following the New Year holiday and ahead of the weekend. The economic calendar will not feature any high-impact data releases.

GBP/USD struggles to gain traction, stabilizes above 1.3450

After testing 1.3400 on the last day of 2025, GBP/USD managed to stage a rebound. Nevertheless, the pair finds it difficult to gather momentum and moves sideways above 1.3450 as market participants remain in holiday mood.

Gold climbs toward $4,400 following deep correction

Gold reverses its direction and advances toward $4,400 after suffering heavy losses amid profit-taking before the New Year holiday. Growing expectations for a dovish Fed policy and persistent geopolitical risks seem to be helping XAU/USD stretch higher.

Cardano gains early New Year momentum, bulls target falling wedge breakout

Cardano kicks off the New Year on a positive note and is extending gains, trading above $0.36 at the time of writing on Friday. Improving on-chain and derivatives data point to growing bullish interest, while the technical outlook keeps an upside breakout in focus.

Economic outlook 2026-2027 in advanced countries: Solidity test

After a year marked by global economic resilience and ending on a note of optimism, 2026 looks promising and could be a year of solid economic performance. In our baseline scenario, we expect most of the supportive factors at work in 2025 to continue to play a role in 2026.

Crypto market outlook for 2026

Year 2025 was volatile, as crypto often is.  Among positive catalysts were favourable regulatory changes in the U.S., rise of Digital Asset Treasuries (DAT), adoption of AI and tokenization of Real-World-Assets (RWA).