Gold Price Forecast: XAU/USD bulls were stopped in their tracks on USD round-trip
- Gold reversed its direction after rising above $1,830 on Wednesday.
- Renewed USD strength is not allowing XAU/USD to gain traction.
- Gold's key technical levels remain intact despite sharp fluctuations.

US session wrap update: XAU/USD was trading flat into the close on Wall Street after a volatile US forex session.
Overall, the yellow metal is trading weak, but the gravitational pull of real rates is keeping the yellow metal supported above $1,800/oz, for now.
XAU/USD was ending at the closing bell near $1,812 moving between $1.806.45 the low for the day and $1,831.75 the high that was scored on brief US dollar weakness.
However, the US dollar turned higher into bullish territory despite the Automatic Data Processing (ADP) Research jobs data missed expectations by a mile.
Private sector employment in the US rose by 330,000 in July vs the 695K estimate and was seen as possibly foreshadowing softness in jobs data due on Friday from the American government.
''The data was at odds with record numbers of jobs vacancies and we’d be cautious in reading too much into the number ahead of Friday’s payrolls data. The sector with the largest job gains was leisure and hospitality (139k), reflecting the ongoing reopening of the economy,'' analysts at ANZ Bank argued.
The dollar recovered quickly when comments from top US Federal Reserve officials appeared to suggest that the central bank may reduce support for the improving economy more quickly than widely thought and raise rates in the near future.
Fed's James Bullard speaking at Wall Street Journal event said that he thinks inflation will be more persistent than some people think. He now sees it at 2 1/2% to 3% in 2022.
Additionally, Fed's Vice Chair Richard Clarida said that he is expecting conditions for raising rates to be met by the end of 2022.
The combination of mixed US data and Fed Vice Chair Clarida painting a positive picture for the US economic outlook was enough to push US 10-year yields higher to 1.2140% after they started the session sharply lower near 1.1270%.
In the volatility, the US dollar has cleared an important milestone in its corrective attempts in the DXY, breaking beyond 92.20 and reaching a high, so far, or 92.308.
On the US dollar charts, the daily recovery path looks like so:
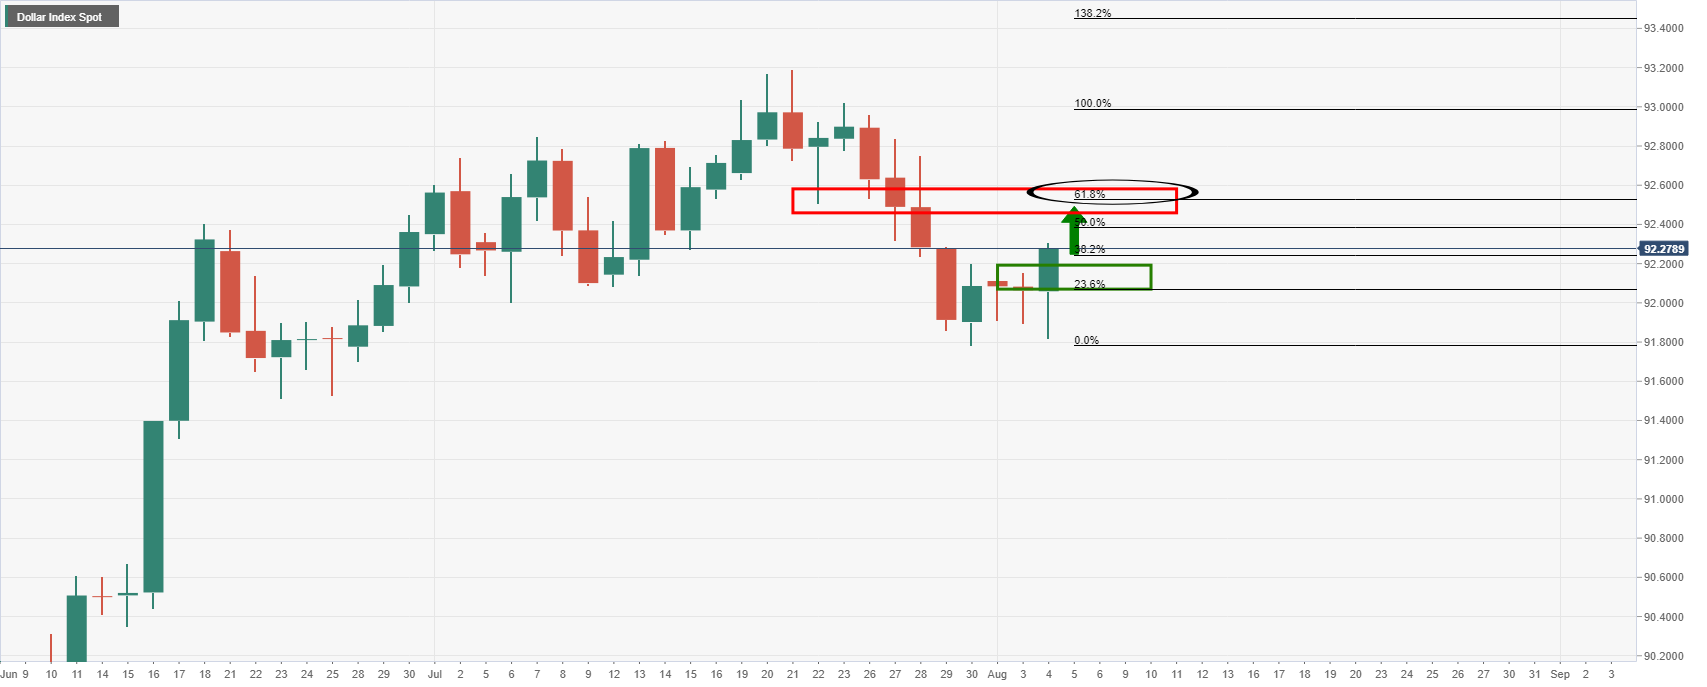
A breach of the 38.2% Fibonacci retracement target opens risk to the neckline of the M-formation near 92.50.
This level is of particular interest because of the confluence of the 61.8% Fibonacci retracement level as a keen target for the bulls and a headwind for gold prices for the foreseeable future, at least until the US Nonfarm Payrolls outcome on Friday.
If the data underwhelms, then a break of $1,834 could seal the deal for the bulls.
On the flip side, should the data prove that the US vaccinations are bringing life back to the jobs sector at a faster rate than imagined, on USD strength, a break of $1,790 will embed a lower for longer gold price outlook towards the $1,730s.
End of US session update
After moving up and down in a relatively narrow range above $1,800 and closing flat on Monday and Tuesday, the XAU/USD pair gained traction and jumped to a daily high above $1,830. However, the renewed USD strength forced the pair to reverse its direction during the American trading hours. As of writing, gold was virtually unchanged on the day at $1,810.
Earlier in the day, the data published by the Automatic Data Processing (ADP) Research showed that private sector employment in the US rose by 330,000 in July. With this print falling short of the market expectation for an increase of 695,000, the USD came under selling pressure. Reflecting the broad-based USD weakness, the US Dollar Index (DXY) dropped to a daily low of 91.90.
Other data from the US revealed that the business activity in the service sector expanded at an unprecedented pace in July. The ISM Services PMI climbed to a new series-high of 64.1 from 60.1 in June. This reading beat analysts' estimate of 60.4 and helped the USD limit its losses.
More importantly, hawkish comments from Fed Vice Chair Richard Clarida provided a strong boost to the greenback and weighed heavily on XAU/USD.
While speaking at an online event hosted by the Peterson Institute for International Economics, Clarida noted that he would support announcing a moderating in the Fed's asset purchases later this year. Regarding the rate outlook, Clarida said that he is expecting conditions for raising rates to be met by the end of 2022.
Following these comments, the DXY shot higher and touched a new weekly high of 92.30. As of writing, the index was up 0.2% at 92.25.
On Thursday, Goods Trade Balance and Initial Jobless Claims reports will be featured in the US economic docket. However, the market reaction to these data is likely to remain short-lived ahead of Friday's Nonfarm Payrolls (NFP) report.
Gold technical outlook
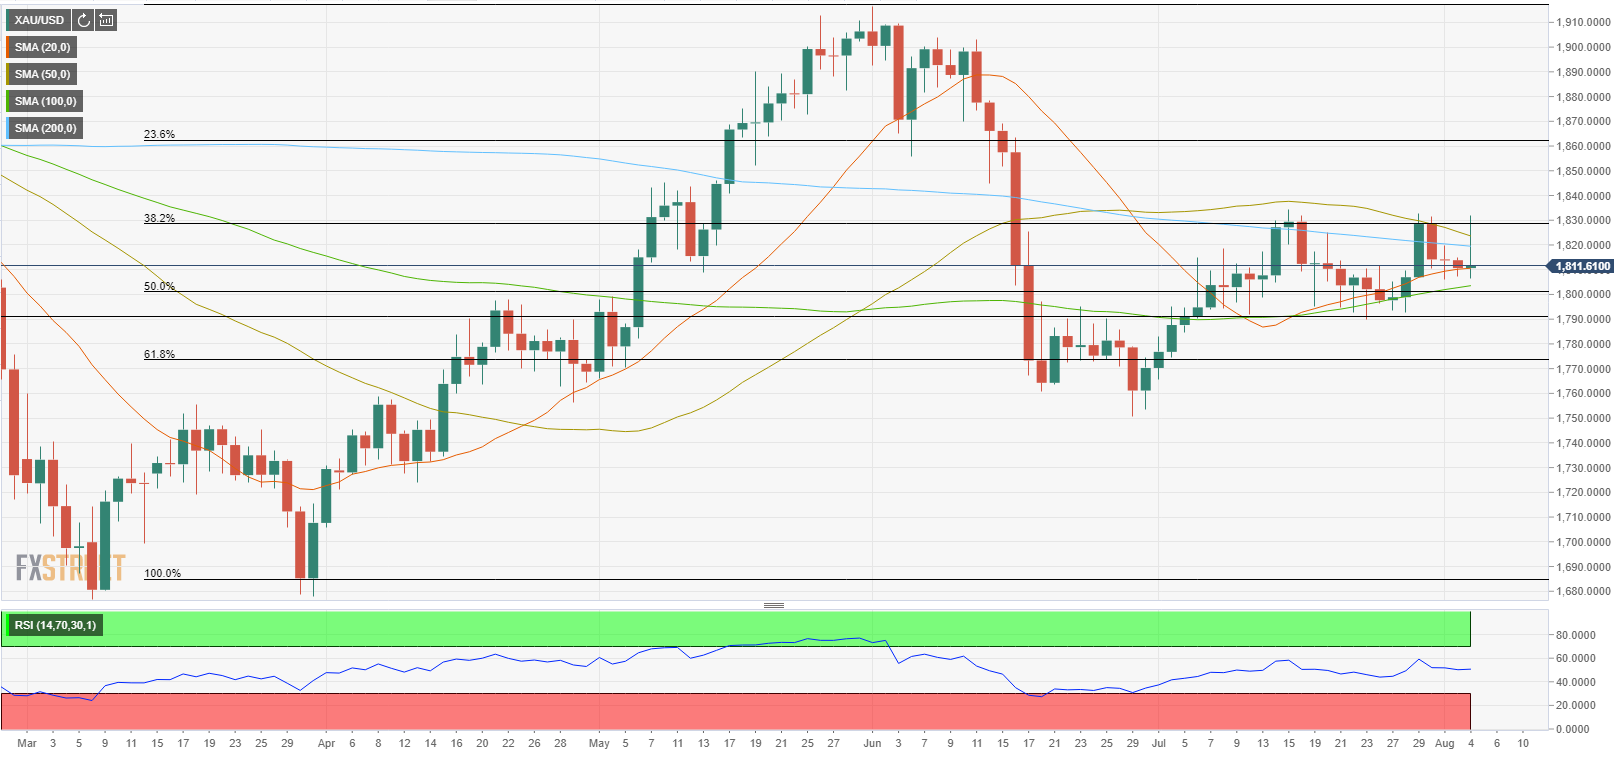
Despite the sharp fluctuations witnessed on Wednesday, gold's near-term technical outlook remains neutral with a slight bearish bias given the fact that buyers failed to hold the price above the 200-day SMA. Meanwhile, the Relative Strength Index (RSI) indicator on the daily chart continues to move sideways near 50, confirming the pair's indecisiveness.
On the upside, the 200-day SMA continues to act as dynamic resistance around $1,820. In case gold manages to make a daily close above that level, the next hurdle could be seen at $1,830 (Fibonacci 38.2% retracement of the April-June uptrend) ahead of $1,835 (July 15 high).
$1,810 (20-day SMA) aligns as interim support before the critical $1,800 level, where the 100-day SMA and the Fibonacci 50% retracement meets, and $1,790 (July 23 low, static level).
Additional levels to watch for
Author

Eren Sengezer
FXStreet
As an economist at heart, Eren Sengezer specializes in the assessment of the short-term and long-term impacts of macroeconomic data, central bank policies and political developments on financial assets.


