Gold Price Forecast: XAU/USD trading flat, poised for potential gains amid light US economic agenda
- Fed Cook: Monetary policy enters uncertain phase, though expect PCE to slow down
- The Chicago Fed National Activity Index improved, but the Dallas Fed manufacturing index deteriorated.
- XAU/USD Price Analysis: Likely to remain sideways, between the 20 and 50-day EMAs.

Gold price is trading sideways amidst the lack of a catalyst during Monday’s North American session, though likely to remain underpinned by US Dollar (USD) weakness and falling US Treasury bond yields. A risk-on impulse keeps the greenback pressured during a week of a light US economic agenda. At the time of writing, the XAU/USD is trading at $1983.50, almost flat.
Gold traders eye uncertain Fed policy as US bond yields tumble
US stocks fluctuate between gainers and losers as the week begins. With US Federal Reserve (Fed) officials getting into the blackout period, Gold traders are leaning to last Friday’s Lisa Cook, Fed Governor words. She said that monetary policy is moving into an uncertain phase and added that banking sector headwinds could weigh on the rate-rising outlook. Cook expects March PCE inflation to decelerate and refrained from asserting the same to core PCE.
US Treasury bond yields, across the board, continue to tumble, a headwind for the greenback. The US Dollar Index (DXY), a measure of the buck’s value against a basket of peers, lost traction, sliding 0.22%, and was last seen at 101.507, a tailwind for XAU/USD.
Expectations of the US Federal Reserve hiking rates by 25 bps in the next week lie at 90%, as shown by the CME FedWatch Tool. Nevertheless, traders estimate that the US central bank “could” cut rates by the September meeting, followed by another one in December.
Over the weekend, reports via the Financial Times reported that central bankers are buying gold, spurred by increased geopolitical tensions, as the World Gould Council said. The reports showed that central banks increased by 152% YoY in 2022.
Data-wise, the US economic docket featured the Chicago Fed National Activity Index (CFNAI) for March, which plunged to -0.19, above estimates of -20, unchanged from February’s reading. The three-month moving average ticked up to 0.01%, which jumped from -0.09 in February, a sign that the economy continues to expand at a slower pace.
Of late, the Dallas Fed Manufacturing Business Index in April plummeted to -23.4, well below the -11.00 estimated, as the survey showed that perceptions of broader business conditions worsened, according to the poll. The rate of change of orders and shipments improved, but both readings remained in negative territory.
XAU/USD Technical Analysis
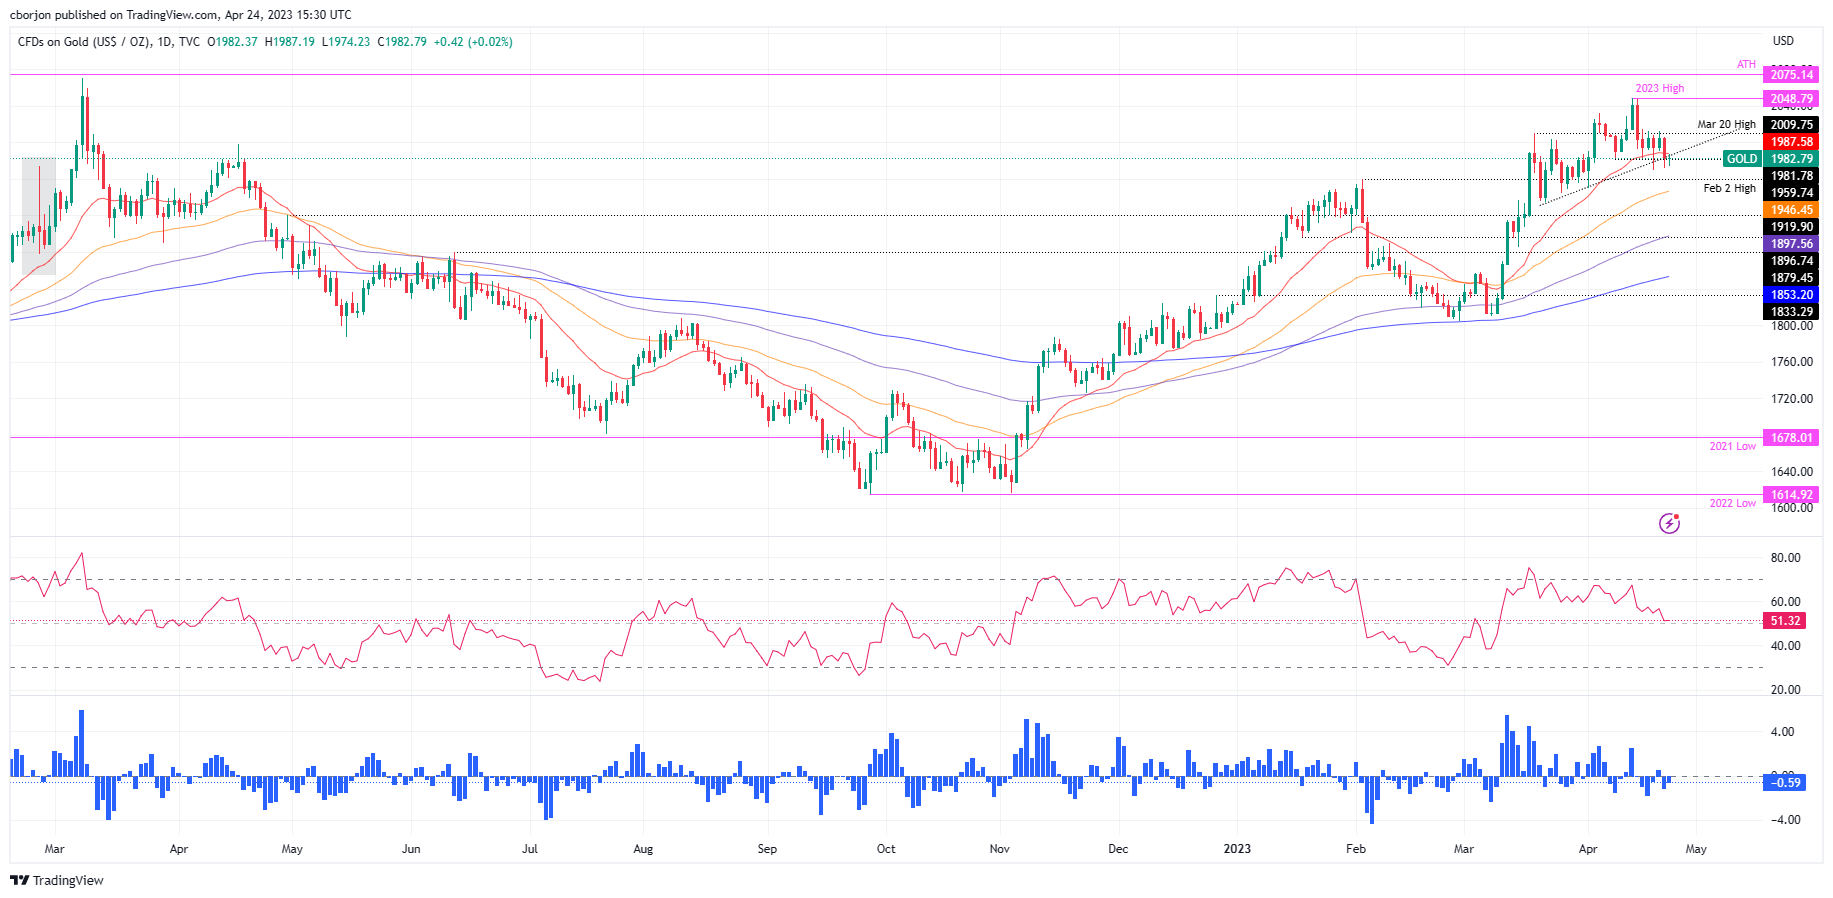
From a technical perspective, XAU/USD is wavering around the 20-day Exponential Moving Average (EMA) at $1987.64, suggesting that the Gold price will likely remain sideways. On the downside, risks lie at $1950 before dropping and testing the 50-day EMA at $1946.45. A breach of the latter will expose the $1900 figure, ahead of the 100-day EMA at $1897.58. Conversely, upside risks are at the 20-day EMA, followed by the $2000 mark.
Author

Christian Borjon Valencia
FXStreet
Markets analyst, news editor, and trading instructor with over 14 years of experience across FX, commodities, US equity indices, and global macro markets.


