Gold Price Forecast: XAU/USD trades sideways around $3,335, awaits clarity on tariff policy
- Gold price oscillates inside Thursday’s trading range around $3,335, exhibits volatility compression.
- US President Trump is expected to announce a couple of trade deals before the tariff deadline on July 9.
- The clearance of Trump’s tax-cut bill has prompted US fiscal risks.

Gold price (XAU/USD) trades well inside Thursday’s trading range around $3,335 during European trading hours on Friday. The yellow metal struggles for direction as investors await clarity of how much United States (US) President Donald trump will impose tariffs on those of his trading partners, which failed to strike a bilateral deal in the 90-day pause period.
US President Trump announced a 90-pause on the imposition of reciprocal tariffs a week after its announcement on April 2 to allow time to his trading partners to close a negotiated trade deal.
So far, Washington has announced trade agreements with the United Kingdom (UK) and Vietnam and has secured a framework agreement with China. Earlier in the day, Trump expressed confidence that he will strike a deal with a couple of nations of which India seems to be the one. Trump stated this week that he expects to secure a deal with India before the tariff deadline on July 9.
Earlier in the day, Trump stated that he will begin “sending letters on trade tariffs starting Friday”.
Market experts believe that the imposition of reciprocal tariffs by the US on nations such as Japan, Eurozone, Canada, and Mexico, which are its key trading partners and have not secured a trade deal will de-stabilize the global trade war.
Theoretically, heightened geopolitical tensions increase demand for safe-haven assets, such as Gold.
Meanwhile, the green signal to Trump’s Big Beautiful Bill” from the House of Representatives has also increase safe-haven demand of the Gold price. Investors worry that Trump’s signature bill will increase already giant national debt by $3-3.5 trillion over a decade, potentially increasing fiscal risks.
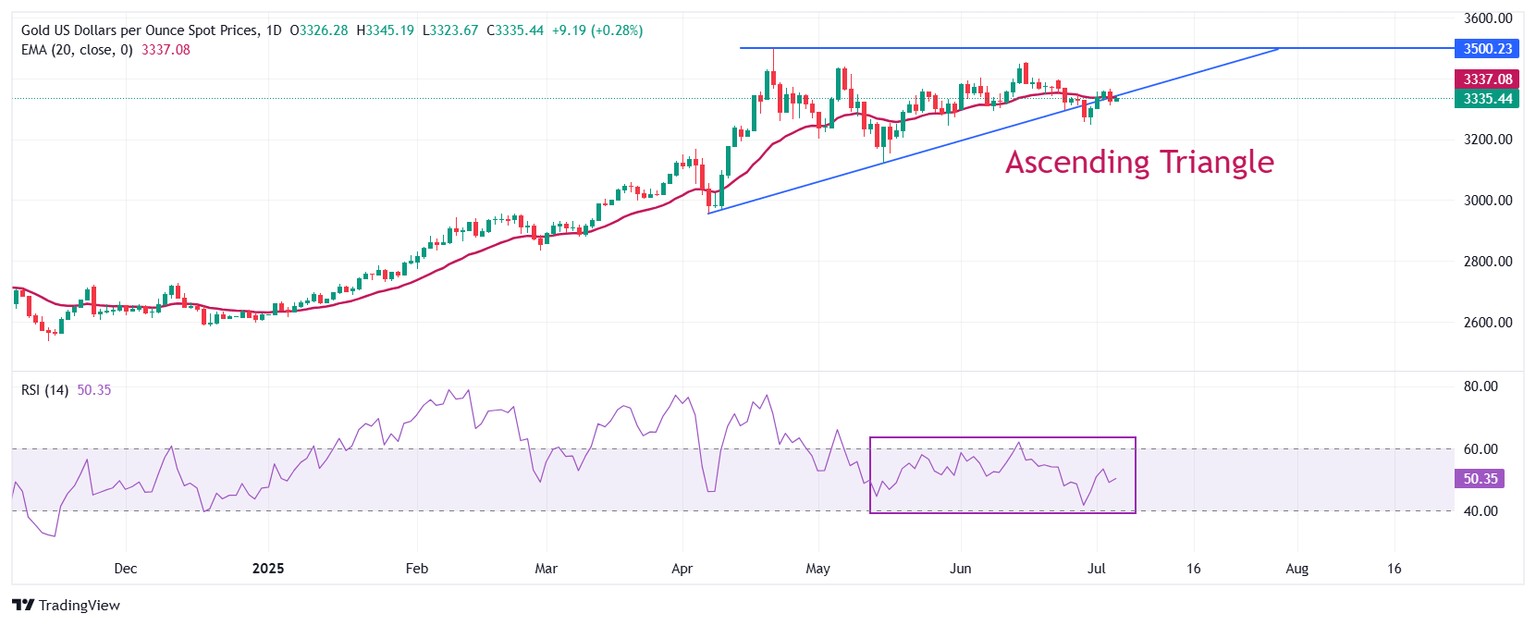
Gold technical analysis
Gold price trades close to the upward-sloping trendline of an Ascending Triangle formation on a daily timeframe, which is placed from the April 7 low of $2,957. The horizontal resistance of the above-mentioned chart pattern is plotted from the April 22 high around $3,500. Theoretically, a breakdown of the asset below the upward-sloping trendline results in a sharp downfall.
The precious metal trades wobbles near the 20-day Exponential Moving Average (EMA) around $3,342, suggesting that the near-term trend is uncertain.
The 14-day Relative Strength Index (RSI) oscillates inside the 40.00-60.00 range, indicating a sideways trend.
Looking up, the Gold price would enter in an unchartered territory after breaking above the psychological level of $3,500 decisively. Potential resistances would be $3,550 and $3,600.
Alternatively, a downside move by the Gold price below the May 29 low of $3,245 would drag it towards the round-level support of $3,200, followed by the May 15 low at $3,121.
Gold daily chart
Gold FAQs
Gold has played a key role in human’s history as it has been widely used as a store of value and medium of exchange. Currently, apart from its shine and usage for jewelry, the precious metal is widely seen as a safe-haven asset, meaning that it is considered a good investment during turbulent times. Gold is also widely seen as a hedge against inflation and against depreciating currencies as it doesn’t rely on any specific issuer or government.
Central banks are the biggest Gold holders. In their aim to support their currencies in turbulent times, central banks tend to diversify their reserves and buy Gold to improve the perceived strength of the economy and the currency. High Gold reserves can be a source of trust for a country’s solvency. Central banks added 1,136 tonnes of Gold worth around $70 billion to their reserves in 2022, according to data from the World Gold Council. This is the highest yearly purchase since records began. Central banks from emerging economies such as China, India and Turkey are quickly increasing their Gold reserves.
Gold has an inverse correlation with the US Dollar and US Treasuries, which are both major reserve and safe-haven assets. When the Dollar depreciates, Gold tends to rise, enabling investors and central banks to diversify their assets in turbulent times. Gold is also inversely correlated with risk assets. A rally in the stock market tends to weaken Gold price, while sell-offs in riskier markets tend to favor the precious metal.
The price can move due to a wide range of factors. Geopolitical instability or fears of a deep recession can quickly make Gold price escalate due to its safe-haven status. As a yield-less asset, Gold tends to rise with lower interest rates, while higher cost of money usually weighs down on the yellow metal. Still, most moves depend on how the US Dollar (USD) behaves as the asset is priced in dollars (XAU/USD). A strong Dollar tends to keep the price of Gold controlled, whereas a weaker Dollar is likely to push Gold prices up.
Author

Sagar Dua
FXStreet
Sagar Dua is associated with the financial markets from his college days. Along with pursuing post-graduation in Commerce in 2014, he started his markets training with chart analysis.


