Gold Price Forecast: XAU/USD to target $1765 and $1772 on buying resurgence – Confluence Detector
- Gold price supported at $1750, as sell-off in yields drag DXY down.
- US political wrangling and tapering worries dent risk appetite.
- Gold remains vulnerable amid hawkish Fed outlook.

Gold price is struggling to extend Thursday’s rebound this Friday, although remains well supported at the $1750 level, as the Q4 2021 kicks off. The bright metal is looking to end the week almost unchanged, as the blistering recovery has helped the bulls find some respite, as gold price is poised to end its three straight weekly losses. The retreat in the US Treasury yields amid risk-off market mood keeps the buoyant tone intact around gold price. Investors remain wary amid a delay in the US political wrangling and Fed’s tapering risks, in light of the surging energy prices and slowing global economic recovery.
Read: Gold analysis: Breaks pattern
Gold Price: Key levels to watch
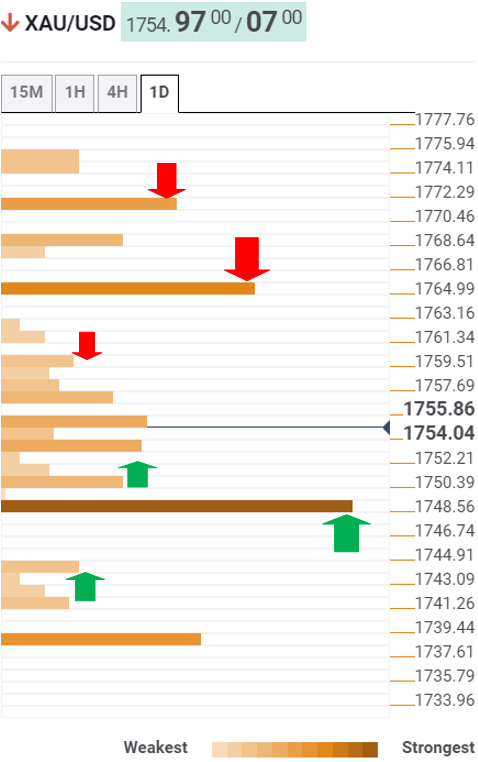
According to the Technical Confluences Detector, gold has regained poise and looks to take on the key resistance at $1765, which is the convergence of the previous day’s high and Fibonacci 38.2% one-month.
Ahead of that, a dense cluster of healthy resistance levels around $1759 will come into play.
Further up, gold buyers target the Fibonacci 61.8% one-week at $1768, above which doors will open up towards the $1772 strong resistance.
Alternatively, sellers could test the $1752 support area should gold price change its course. That is the confluence zone of the SMA10 one-day, Fibonacci 23.6% one-week and SMA50 four-hour.
The recovery momentum will likely remain intact so long as gold price holds above the $1748 level. At that point, the Fibonacci 38.2% one-day coincides with the Fibonacci 23.6% one-month.
The last demand zone is seen at around $1742, the intersection of the SMA5 one-day, SMA100 one-hour and SMA10 four-hour.
Here is how it looks on the tool
About Technical Confluences Detector
The TCD (Technical Confluences Detector) is a tool to locate and point out those price levels where there is a congestion of indicators, moving averages, Fibonacci levels, Pivot Points, etc. If you are a short-term trader, you will find entry points for counter-trend strategies and hunt a few points at a time. If you are a medium-to-long-term trader, this tool will allow you to know in advance the price levels where a medium-to-long-term trend may stop and rest, where to unwind positions, or where to increase your position size.
Author

Dhwani Mehta
FXStreet
Residing in Mumbai (India), Dhwani is a Senior Analyst and Manager of the Asian session at FXStreet. She has over 10 years of experience in analyzing and covering the global financial markets, with specialization in Forex and commodities markets.


