Gold Price Forecast: XAU/USD ticks up to renew YTD high near $2,000 as week-start optimism fades


  • Gold price picks up bids to reverse the early-day losses within one-week-old bullish channel.
  • Global central banks’ moves to infuse US Dollar liquidity, UBS-Credit Suisse deal earlier favored risk-on mood.
  • Details of efforts to push back fears from banking sector fallout appear less lucrative amid hawkish central bank bias.
  • Woes for Credit Suisse bondholders, cautious mood ahead of top-tier data/events weigh on sentiment.

Gold price (XAU/USD) ticks up to $1,993 as it renews the yearly high during Monday’s European session, reversing the Asian session’s losses amid fresh challenges to the risk appetite. It’s worth noting that the metal rose the most on a daily, as well as on a weekly, basis in the last amid broad weakness of the US Treasury bond yields and the US Dollar.

The latest run-up of the yellow metal could be linked to the fears of banking sector rout despite the efforts of the major central banks and private banks. Also challenging the sentiment are the fears of more rate hikes, as well as negative results of a deal between Credit Suisse and UBS.

That said, news surrounding the major central banks’ coordinated efforts to fuel the market’s liquidity joined the headlines suggesting the UBS takeover of the troubled Credit Suisse to underpin the recovery in the sentiment during the early Asian session.

Though, the details of the UBS-Credit Suisse deal suggest losses for the Credit Suisse AT1 bondholders, which in turn probed the weak-start optimism. On the same line are the interest rate futures that suggest the upcoming hawkish actions from the key central bank. It should be noted that the fears of more banking sector fallout also weigh on the US Treasury bond yields and allow the Gold price to remain firmer.

Against this backdrop, the S&P 500 Futures reverse the week-start gains while the US 10-year and two-year Treasury bond yield retreat towards multi-day lows marked the previous day. It’s worth noting that United States two-year Treasury bond yields marked the biggest weekly loss in three years while the 10-year counterpart dropped the most since early January.

Looking forward, risk catalysts and the bond market moves could entertain the Gold traders ahead of the monetary policy meetings of the Federal Reserve (Fed), Swiss National Bank (SNB) and the Bank of England (BoE). Also important to watch will be the March month’s first readings of activity numbers for the major economies.

Gold price technical analysis

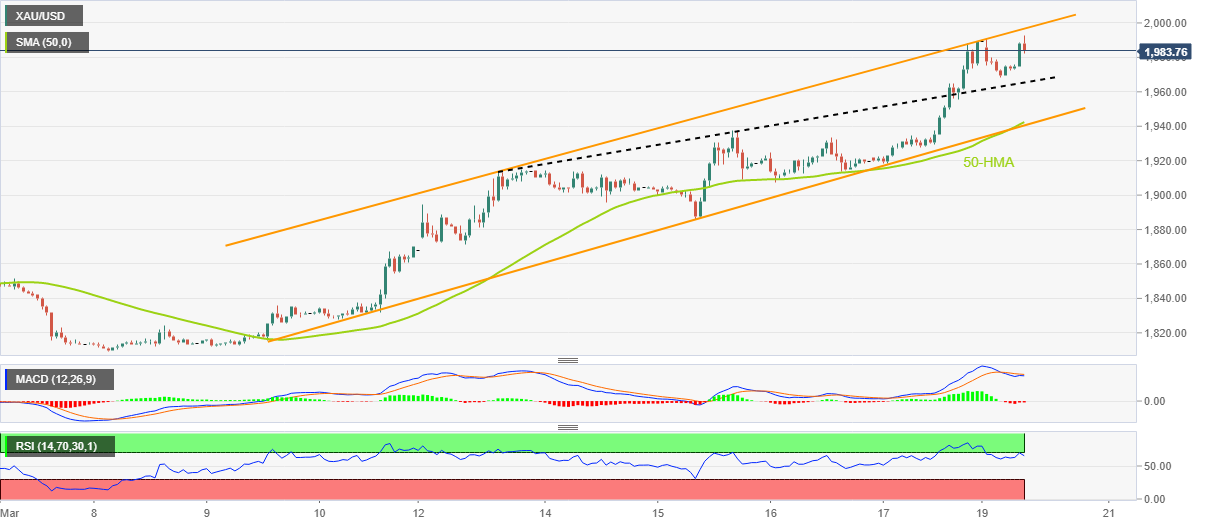
Gold buyers took a breather during early Monday as the RSI (14) turned overbought. The pullback moves, however, failed to break the previous resistance line from March 13, close to $1,965 by the press time.

In doing so, the XAU/USD remains inside a one-week-old bullish trend channel amid upbeat MACD signals.

As a result, the metal’s upside toward refreshing the Year-To-Date high can’t be ruled out.

However, the stated bullish channel’s top line and the April 2022 high, respectively near $1,996 and $1,998, will precede the $2,000 psychological magnet to challenge the Gold buyers.

Following that, a run-up towards the previous yearly peak surrounding $2,070 can’t be ruled out.

Alternatively, pullback moves need validation from the $1,965 but the Gold seller may feel relived only if the XAU/USD price remains bearish past the $1,942-40 support confluence, encompassing the aforementioned channel’s lower line and the 50-Hour Moving Average (HMA).

Gold price: Hourly chart

Trend: Limited upside expected

Additional important levels

Overview
Today last price 1984.34
Today Daily Change -5.12
Today Daily Change % -0.26%
Today daily open 1989.46
 
Trends
Daily SMA20 1856.42
Daily SMA50 1879.63
Daily SMA100 1824.16
Daily SMA200 1776.95
 
Levels
Previous Daily High 1989.51
Previous Daily Low 1918.31
Previous Weekly High 1989.51
Previous Weekly Low 1867.66
Previous Monthly High 1959.8
Previous Monthly Low 1804.76
Daily Fibonacci 38.2% 1962.31
Daily Fibonacci 61.8% 1945.51
Daily Pivot Point S1 1942.01
Daily Pivot Point S2 1894.56
Daily Pivot Point S3 1870.81
Daily Pivot Point R1 2013.21
Daily Pivot Point R2 2036.96
Daily Pivot Point R3 2084.41


Share: Feed news

Information on these pages contains forward-looking statements that involve risks and uncertainties. Markets and instruments profiled on this page are for informational purposes only and should not in any way come across as a recommendation to buy or sell in these assets. You should do your own thorough research before making any investment decisions. FXStreet does not in any way guarantee that this information is free from mistakes, errors, or material misstatements. It also does not guarantee that this information is of a timely nature. Investing in Open Markets involves a great deal of risk, including the loss of all or a portion of your investment, as well as emotional distress. All risks, losses and costs associated with investing, including total loss of principal, are your responsibility. The views and opinions expressed in this article are those of the authors and do not necessarily reflect the official policy or position of FXStreet nor its advertisers. The author will not be held responsible for information that is found at the end of links posted on this page.

If not otherwise explicitly mentioned in the body of the article, at the time of writing, the author has no position in any stock mentioned in this article and no business relationship with any company mentioned. The author has not received compensation for writing this article, other than from FXStreet.

FXStreet and the author do not provide personalized recommendations. The author makes no representations as to the accuracy, completeness, or suitability of this information. FXStreet and the author will not be liable for any errors, omissions or any losses, injuries or damages arising from this information and its display or use. Errors and omissions excepted.

The author and FXStreet are not registered investment advisors and nothing in this article is intended to be investment advice.

Recommended content


Recommended content

Editors’ Picks

AUD/USD failed just ahead of the 200-day SMA

AUD/USD failed just ahead of the 200-day SMA

Finally, AUD/USD managed to break above the 0.6500 barrier on Wednesday, extending the weekly recovery, although its advance faltered just ahead of the 0.6530 region, where the key 200-day SMA sits.

AUD/USD News

EUR/USD met some decent resistance above 1.0700

EUR/USD met some decent resistance above 1.0700

EUR/USD remained unable to gather extra upside traction and surpass the 1.0700 hurdle in a convincing fashion on Wednesday, instead giving away part of the weekly gains against the backdrop of a decent bounce in the Dollar.

EUR/USD News

Gold keeps consolidating ahead of US first-tier figures

Gold keeps consolidating ahead of US first-tier figures

Gold finds it difficult to stage a rebound midweek following Monday's sharp decline but manages to hold above $2,300. The benchmark 10-year US Treasury bond yield stays in the green above 4.6% after US data, not allowing the pair to turn north.

Gold News

Bitcoin price could be primed for correction as bearish activity grows near $66K area

Bitcoin price could be primed for correction as bearish activity grows near $66K area

Bitcoin (BTC) price managed to maintain a northbound trajectory after the April 20 halving, despite bold assertions by analysts that the event would be a “sell the news” situation. However, after four days of strength, the tables could be turning as a dark cloud now hovers above BTC price.

Read more

Bank of Japan's predicament: The BOJ is trapped

Bank of Japan's predicament: The BOJ is trapped

In this special edition of TradeGATEHub Live Trading, we're joined by guest speaker Tavi @TaviCosta, who shares his insights on the Bank of Japan's current predicament, stating, 'The BOJ is Trapped.' 

Read more

Forex MAJORS

Cryptocurrencies

Signatures