- Gold price is making efforts for maintaining its auction above $1,940.00.
- The recent rally in the Gold price was driven was weakness in the USD Index and fears of a banking sector meltdown.
- The USD Index is showing a subdued performance as odds for a 25bp rate hike by the Fed are accelerating.
Gold price (XAU/USD) has reverted to the $1,940.00 support after failing to extend its recovery above $1,946.00 in the Asian session. The precious metal is expected to remain sideways as investors are likely to execute meaningful positions after the announcement of the interest rate decision by the Federal Reserve (Fed).
It is worth noting that the Gold price is struggling to maintain its feet despite a subdued performance by the US Dollar Index (DXY). The recent rally in the Gold price was driven was weakness in the USD Index and stalwart fears of a banking sector meltdown in the United States after the collapse of three mid-size banks last week.
The commentary from United States Treasury Secretary Janet Yellen that Fed’s new Bank Term Funding facility and discount window lending are working to provide liquidity to the banking system has trimmed fears of further turmoil in the banking system. Also, the statement infused fresh blood into the share price of First Republic Bank on Tuesday. Earlier, the safe-haven appeal for Gold got firmer as investors shifted their money to bullions to safeguard themselves from sheer volatility.
The US Dollar Index (DXY) is continuously hovering around 103.20 as investors are cheering accelerating odds for a 25 basis point (bp) interest rate hike by the Fed. As per the CME Fedwatch tool, 85% chances are in favor of a 25bp rate hike, which would push rates to 4.75-5.00%.
Gold technical analysis
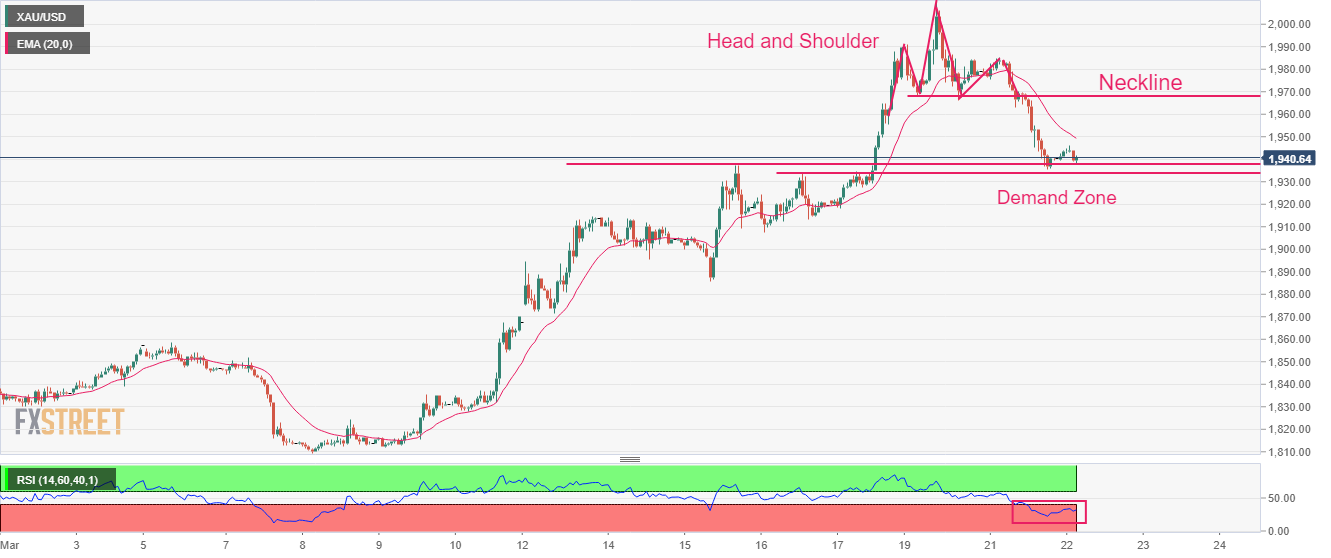
Gold price delivered a perpendicular decline after a breakdown of the Head and Shoulder chart pattern on an hourly scale. A breakdown of the aforementioned chart pattern indicates a bearish reversal after a consolidation move. The Gold price has dropped to near the demand zone placed in a range of $1,933.90-1,938.40.
The 20-period Exponential Moving Average (EMA) at around $1,950.00 would continue to act as a barricade for Gold bulls.
Meanwhile, the Relative Strength Index (RSI) (14) is oscillating in the bearish range of 20.00-40.00, which indicates the downside momentum is still active.
Gold hourly chart
Information on these pages contains forward-looking statements that involve risks and uncertainties. Markets and instruments profiled on this page are for informational purposes only and should not in any way come across as a recommendation to buy or sell in these assets. You should do your own thorough research before making any investment decisions. FXStreet does not in any way guarantee that this information is free from mistakes, errors, or material misstatements. It also does not guarantee that this information is of a timely nature. Investing in Open Markets involves a great deal of risk, including the loss of all or a portion of your investment, as well as emotional distress. All risks, losses and costs associated with investing, including total loss of principal, are your responsibility. The views and opinions expressed in this article are those of the authors and do not necessarily reflect the official policy or position of FXStreet nor its advertisers. The author will not be held responsible for information that is found at the end of links posted on this page.
If not otherwise explicitly mentioned in the body of the article, at the time of writing, the author has no position in any stock mentioned in this article and no business relationship with any company mentioned. The author has not received compensation for writing this article, other than from FXStreet.
FXStreet and the author do not provide personalized recommendations. The author makes no representations as to the accuracy, completeness, or suitability of this information. FXStreet and the author will not be liable for any errors, omissions or any losses, injuries or damages arising from this information and its display or use. Errors and omissions excepted.
The author and FXStreet are not registered investment advisors and nothing in this article is intended to be investment advice.
Recommended content
Editors’ Picks
EUR/USD drops toward 1.0650 ahead of German inflation data

EUR/USD is falling toward 1.0650 in European trading. Dismal China's Manufacturing PMI and pre-US debt deal vote anxiety support the safe-haven US Dollar while markets pare ECB rate hike bets after softer French inflation data. German inflation data, Fedspeak and US House vote eyed.
GBP/USD extends losses toward 1.2350 amid firmer US Dollar

GBP/USD is extending losses toward 1.2350 in the European session. Markets stay jittery amid China growth worries and ahead of the US House vote on the debt deal. Hawkish Fed's Mester underpins the ongoing US Dollar upsurge. More Fedspeak in focus.
Gold price rebound eyes $1,990 and US factors

Gold Price picks up bids to refresh intraday high as buyers cheer a two-day winning streak, after refreshing the lowest levels in 10 weeks. In doing so, the XAU/USD fails to justify the latest rebound in the DXY but aptly cheers the downbeat Treasury bond yields.
BTC bulls recovery plan targets $30,000 as bears exhaust

Bitcoin action slows down, allowing bears to doubt their strength. As more time elapses, the chances of bulls taking over control of BTC become more likely. A spillover effect would be noticeable in Ethereum and Ripple prices.
Risk off flow into month end

We had warned against the market wanting to get overly excited about the news of a US debt ceiling deal that was always going to get done. And now that this reality is coming to fruition, it’s back to focusing on the market drivers where investors need to focus.