|

Gold Price Forecast: XAU/USD steadies around $1,850 as DXY baffles on stable US inflation ahead

  • Gold price is struggling to hold itself above $1,850.00 ahead of US inflation.
  • Firmer US NFP and inflation expectations are compelling for a 50 bps rate hike next week.
  • An Ascending Triangle formation is indicating a consolidation ahead.

Gold price (XAU/USD) is displaying back and forth moves in the Asian session. The precious metal is oscillating in a $2 range after a pullback move from Tuesday’s high at $1,855.64. The mega event of the US inflation this week is going to insert extreme volatility in the FX domain as May inflation figures will have a significant impact on the stance to be adopted by the Federal Reserve (Fed) next week.

Considering the upbeat US Nonfarm Payrolls and above 8% annual inflation figure, Fed chair Jerome Powell may dictate an aggressive interest rate policy. No doubt, higher price pressures are eating the paychecks of households in the US, which seeks exclusive attention from the Fed. Therefore, a consecutive rate hike announcement of 50 basis points (bps) by Fed Powell will be an optimal decision to keep up the fight against inflation.

Meanwhile, the US dollar index (DXY) is facing barricades around its critical resistance at 102.48.  A rebound in the positive market sentiment on Tuesday trimmed the DXY’s appeal and underpinned the risk-perceived currencies. For an upside move, the DXY needs to violate Tuesday’s high at 102.84.

Gold technical analysis

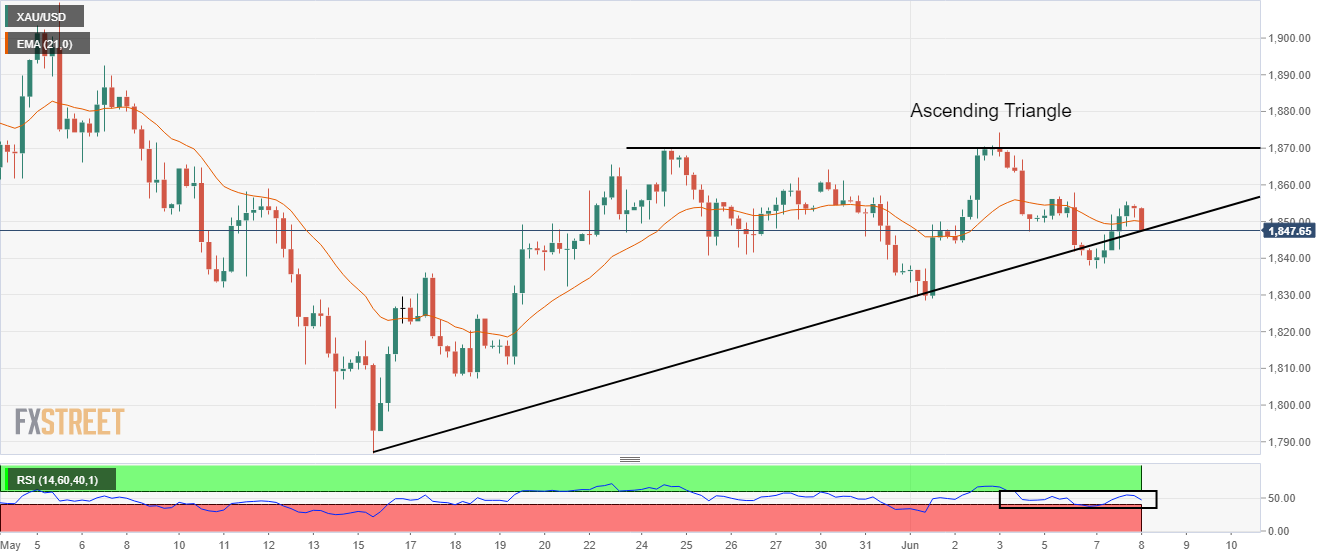
On a four-hour scale, XAU/USD is trading in an Ascending Triangle chart pattern whose upward sloping trendline is placed from May 16 low at $1,786.94 while the horizontal resistance is plotted from May 24 high at $1,869.69. The 21-period Exponential Moving Average (EMA) at $1,850.00 is overlapping with the gold prices, which signals a consolidation ahead. Meanwhile, the Relative Strength Index (RSI) (14) is oscillating in the 40.00-60.00 range, which confirms topsy-turvy moves in upcoming sessions.

Gold four-hour chart

XAU/USD

Overview
Today last price1847.64
Today Daily Change-4.72
Today Daily Change %-0.25
Today daily open1852.36
 
Trends
Daily SMA201843.06
Daily SMA501888.52
Daily SMA1001889.38
Daily SMA2001841.65
 
Levels
Previous Daily High1855.59
Previous Daily Low1837.11
Previous Weekly High1874.16
Previous Weekly Low1828.55
Previous Monthly High1909.83
Previous Monthly Low1786.94
Daily Fibonacci 38.2%1848.53
Daily Fibonacci 61.8%1844.17
Daily Pivot Point S11841.12
Daily Pivot Point S21829.87
Daily Pivot Point S31822.64
Daily Pivot Point R11859.6
Daily Pivot Point R21866.83
Daily Pivot Point R31878.08


Author

Sagar Dua

Sagar Dua

FXStreet

Sagar Dua is associated with the financial markets from his college days. Along with pursuing post-graduation in Commerce in 2014, he started his markets training with chart analysis.

More from Sagar Dua
Share:

Editor's Picks

EUR/USD flirts with yearly lows in the sub-1.1600 area

EUR/USD adds to Monday’s heavy losses and breaks below the key 1.1600 support on Tuesday, putting the YTD lows around 1.1570 to the test. The pair’s deep pullback comes as the US Dollar extend its strong bounce, always propped up by the intense  flight-to-safety environment.

GBP/USD attacks 1.3300, refreshing three-month lows

GBP/USD is deep in the red near 1.3300, accelerating its downside to renew three-month lows in European trading on Tuesday. The ongoing escalation in the Iran war, combined with rising Oil prices, weighs negatively on the higher-yielding Pound Sterling as the US Dollar capitalizes on increased haven demand.

Gold remains offered around $5,170

Gold comes under renewed and marked selling pressure on Tuesday, hovering around the $5,170 mark per troy ounce and reversing four consecutive daily advances. The yellow metal’s bearish tone comes on the back of the increasing demand for the Greenback at the time when investors continue to trim bets on further Fed rate cuts.

Crypto Today: Bitcoin, Ethereum, XRP pull back as sentiment remains in extreme market fear

The cryptocurrency market is broadly in the red on Tuesday as the Middle East grapples with an escalating war. Bitcoin (BTC) is in a pullback, trading below $67,000 at the time of writing, and most altcoins follow suit.

Middle East conflict ramps up a gear as energy price spike rips through markets

It’s another risk off day as geopolitical headwinds continue to batter financial markets. Although markets calmed during the US session and US stocks managed to post gains on Monday, this has not fed through to the European session, and stocks and bonds are sharply lower for a second day.

Hyperliquid Price Forecast: HYPE rises on commodities demand amid US-Iran war

Hyperliquid (HYPE) steadies above $33 at press time on Tuesday, marking its fourth consecutive day of recovery in a broadly volatile market due to the ongoing US-Israel strikes on Iran.