|

Gold Price Forecast: XAU/USD stares $1,900 as Fed rate pause rumors might offset post-US NFP

  • Gold price is eyeing more weakness to near $1,900.00 after an inventory distribution breakdown.
  • Higher US labor cost data could shrug off Fed’s policy tightening pause rumors ahead.
  • S&P500 has displayed a three-day winning streak despite further policy tightening by the Fed.

Gold price (XAU/USD) nosedived to near $1,912.00 after a blockbuster recovery move from the US Dollar Index (DXY) on Thursday. The precious metal is staring at the round-level resistance of $1,900.00 as further downside looks possible ahead of the United States Nonfarm Payrolls (NFP) data.

The downside pressure in the USD Index led by rising expectations that the Federal Reserve (Fed) might consider a pause in the policy tightening as the US inflation is softening significantly has been shrugged off. The US labor cost index is still solid and carries the ability to dismantle the Fed policy pause context.

In the US NFP gamut, Analysts at TD Securities expect a 220K increase in payroll and a modest increase in the Unemployment Rate to 3.6%. As per the consensus, Average Hourly Earnings data is seen at 4.9% vs. the prior release of 4.6% on an annual basis. While monthly data is seen steady at 0.3%. Led by exceeding labor demand against the supply, higher negotiation power in favor of job seekers could dent the price index declining trend, which can shrug off the rumors calling for a pause in the policy tightening pace by the Fed.

Meanwhile, risk-perceived assets like S&P500 have displayed a three-day winning streak despite further policy tightening by the Fed.

Gold technical analysis

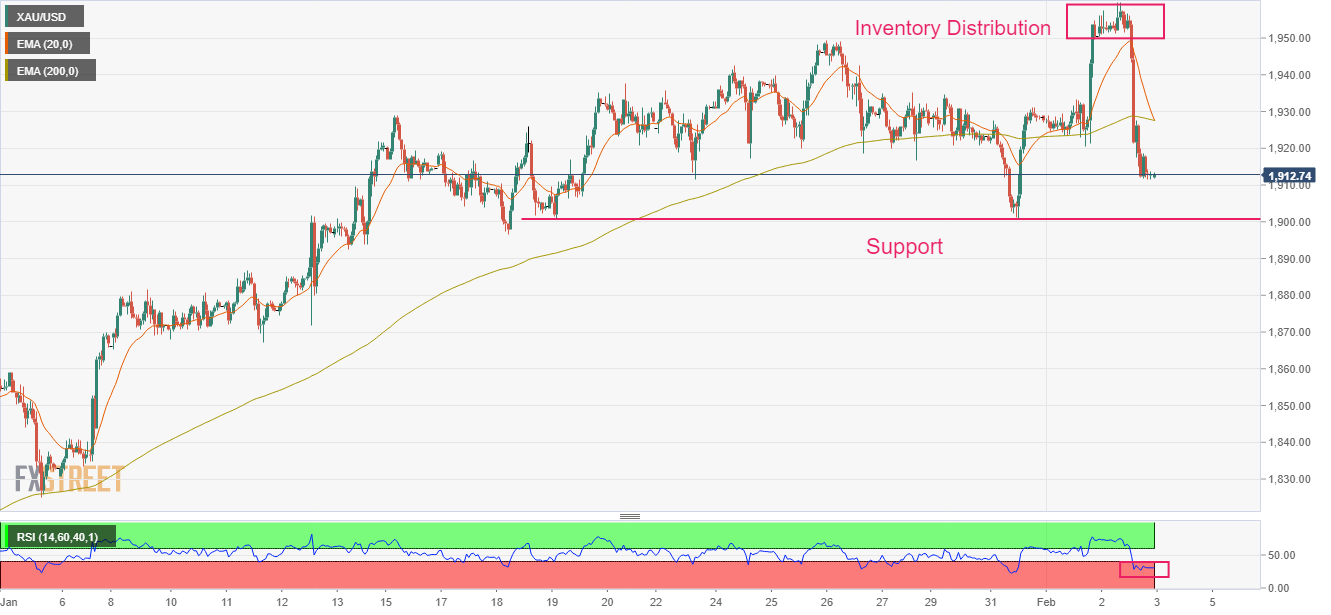
Gold price has demonstrated a perpendicular sell-off after an Inventory Distribution chart formation on an hourly scale. The inventory distribution in a minor range of $1,950-1,960 indicates a shift of inventory from institutional investors to retail participants. The 20-and 200-period Exponential Moving Averages (EMAs) have delivered a bear cross at $1,927.80, which indicates more weakness ahead.

In addition to that, the Relative Strength Index (RSI) (14) has shifted into the bearish range of 20.00-40.00, which indicates that the downside momentum has been triggered.

Gold hourly chart

XAU/USD

Overview
Today last price1912.78
Today Daily Change-40.78
Today Daily Change %-2.09
Today daily open1953.56
 
Trends
Daily SMA201910.49
Daily SMA501840.72
Daily SMA1001762.09
Daily SMA2001776.05
 
Levels
Previous Daily High1953.6
Previous Daily Low1920.61
Previous Weekly High1949.27
Previous Weekly Low1911.45
Previous Monthly High1949.27
Previous Monthly Low1823.76
Daily Fibonacci 38.2%1941
Daily Fibonacci 61.8%1933.21
Daily Pivot Point S11931.58
Daily Pivot Point S21909.6
Daily Pivot Point S31898.59
Daily Pivot Point R11964.57
Daily Pivot Point R21975.58
Daily Pivot Point R31997.56

Author

Sagar Dua

Sagar Dua

FXStreet

Sagar Dua is associated with the financial markets from his college days. Along with pursuing post-graduation in Commerce in 2014, he started his markets training with chart analysis.

More from Sagar Dua
Share:

Markets move fast. We move first.

Orange Juice Newsletter brings you expert driven insights - not headlines. Every day on your inbox.

By subscribing you agree to our Terms and conditions.

Editor's Picks

EUR/USD bounces toward 1.1750 as US Dollar loses strength

EUR/USD returned to the 1.1750 price zone in the American session on Friday, despite falling Wall Street, which indicates risk aversion. Trading conditions remain thin following the New Year holiday and ahead of the weekend, with the focus shifting to US employment and European data scheduled for next week.

GBP/USD nears 1.3500, holds within familiar levels

After testing 1.3400 on the last day of 2025, GBP/USD managed to stage a rebound. Nevertheless, the pair finds it difficult to gather momentum and trades with modest intraday gains at around 1.3490 as market participants remain in holiday mood.

Gold trims intraday gains, approaches $4,300

Gold retreated sharply from the $4,400  area and trades flat for the day in the $4,320 price zone. Choppy trading conditions exacerbated the intraday decline, although XAU/USD bearish case is out of the picture, considering growing expectations for a dovish Fed and persistent geopolitical tensions.

Cardano gains early New Year momentum, bulls target falling wedge breakout

Cardano kicks off the New Year on a positive note and is extending gains, trading above $0.36 at the time of writing on Friday. Improving on-chain and derivatives data point to growing bullish interest, while the technical outlook keeps an upside breakout in focus.

Economic outlook 2026-2027 in advanced countries: Solidity test

After a year marked by global economic resilience and ending on a note of optimism, 2026 looks promising and could be a year of solid economic performance. In our baseline scenario, we expect most of the supportive factors at work in 2025 to continue to play a role in 2026.

Crypto market outlook for 2026

Year 2025 was volatile, as crypto often is.  Among positive catalysts were favourable regulatory changes in the U.S., rise of Digital Asset Treasuries (DAT), adoption of AI and tokenization of Real-World-Assets (RWA).