Gold Price Forecast: XAU/USD slumps to near $3,360, fails to break triangle on upside
- Gold price falls significantly as hopes of US-EU trade agreement ease global trade tensions.
- Washington has slashed baseline and automobile tariff rate on imports from Tokyo to 15%.
- The next major trigger for the Gold price will be Fed’s monetary policy announcement.

Gold price (XAU/USD) trades almost 0.7% lower around $3,360 during the European trading session on Thursday. The precious metal faces a sharp selling pressure as global trade worries have eased amid hopes that the United States (US) and the European Union (EU) will close a trade agreement before the August 1 tariff deadline.
On Wednesday, a report from Financial Times (FT) showed that EU officials have signaled green signal to a trade pact with the US to avert a damaging trade war. Market experts believe the US-Japan deal confirmed on Tuesday increased fears among EU officials that they could their automobile export market share in the US economy, as Washington has slashed tariffs on cars from Tokyo to 15%.
The minutes of the US-Japan deal showed that the baseline and automobile levy on imports from Tokyo to Washington will be 15%. The US charges 25% import duty on all foreign cars, which is separate from the baseline tariff rate.
Easing global trade tensions have diminished demand for safe-haven assets, such as Gold.
Meanwhile, a slight recovery move in the US Dollar (US) seen during the day has also weighed on the Gold price. Technically, a higher US Dollar makes the Gold price an expensive bet for investors.
The US Dollar Index (DXY), which tracks the Greenback’s value against six major currencies, rebounds to near 97.40 after posting a fresh over two-week low near 97.00 earlier in the day.
Going forward, the major trigger for the Gold price will be the Federal Reserve’s (Fed) monetary policy meeting, which is scheduled for next week.
Gold technical analysis
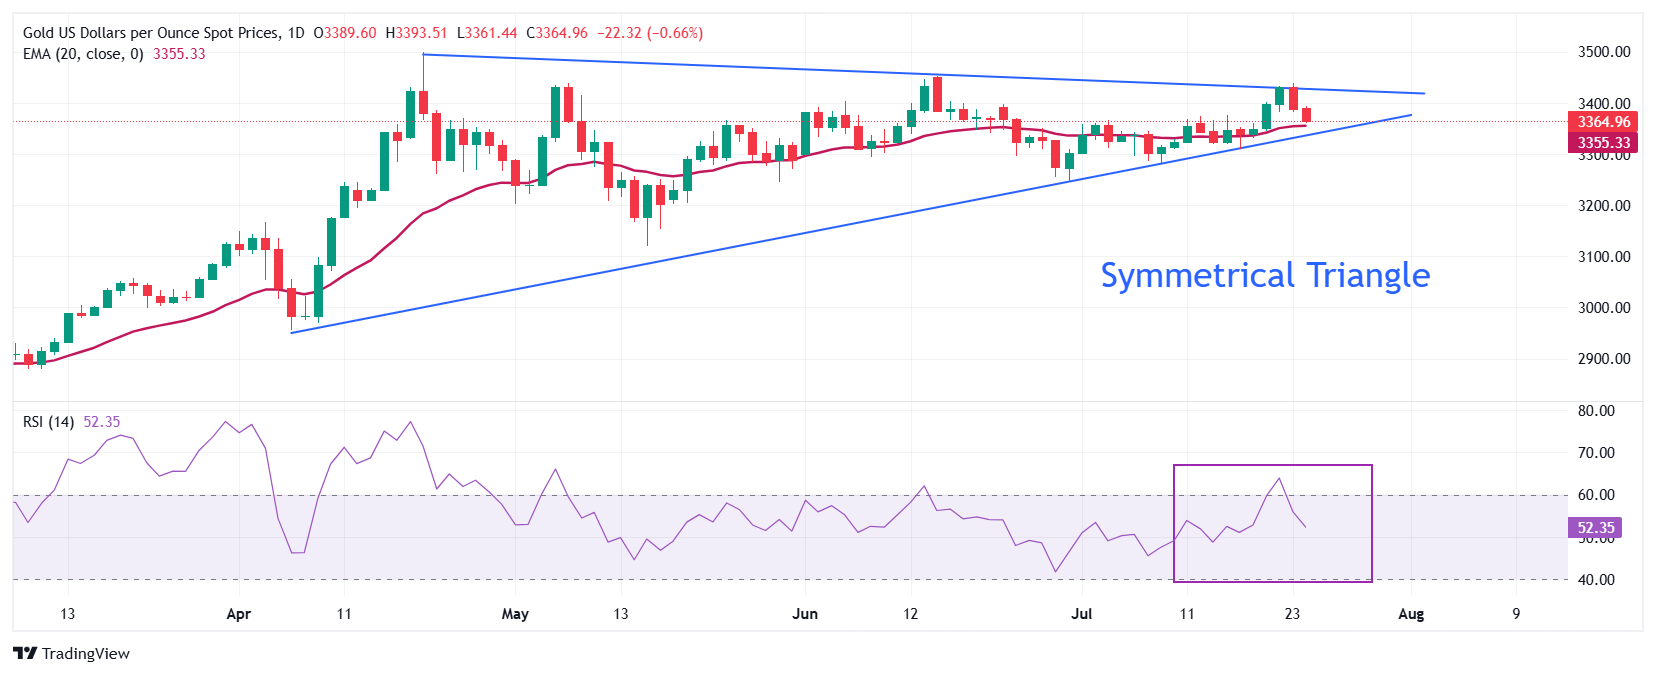
Gold price faces selling pressure after failing to break the Symmetrical Triangle formation on the upside – a move that often leads to volatility expansion. The upward-sloping trendline of the above-mentioned chart pattern is placed from the May 15 low of $3,120.83, while its downward-sloping border is plotted from the April 22 high around $3,500
The 20-day Exponential Moving Average (EMA) still acts as a key support area for the Gold price around $3,355.
The 14-day Relative Strength Index (RSI) falls inside the 40.00-60.00 range, suggesting selling pressure at higher levels.
The Gold price would fall towards the round-level support of $3,200 and the May 15 low at $3,121, if it breaks below the May 29 low of $3,245.
Looking up, the Gold price will enter in an unchartered territory if it breaks above the psychological level of $3,500 decisively. Potential resistances would be $3,550 and $3,600.
Gold daily chart
Gold FAQs
Gold has played a key role in human’s history as it has been widely used as a store of value and medium of exchange. Currently, apart from its shine and usage for jewelry, the precious metal is widely seen as a safe-haven asset, meaning that it is considered a good investment during turbulent times. Gold is also widely seen as a hedge against inflation and against depreciating currencies as it doesn’t rely on any specific issuer or government.
Central banks are the biggest Gold holders. In their aim to support their currencies in turbulent times, central banks tend to diversify their reserves and buy Gold to improve the perceived strength of the economy and the currency. High Gold reserves can be a source of trust for a country’s solvency. Central banks added 1,136 tonnes of Gold worth around $70 billion to their reserves in 2022, according to data from the World Gold Council. This is the highest yearly purchase since records began. Central banks from emerging economies such as China, India and Turkey are quickly increasing their Gold reserves.
Gold has an inverse correlation with the US Dollar and US Treasuries, which are both major reserve and safe-haven assets. When the Dollar depreciates, Gold tends to rise, enabling investors and central banks to diversify their assets in turbulent times. Gold is also inversely correlated with risk assets. A rally in the stock market tends to weaken Gold price, while sell-offs in riskier markets tend to favor the precious metal.
The price can move due to a wide range of factors. Geopolitical instability or fears of a deep recession can quickly make Gold price escalate due to its safe-haven status. As a yield-less asset, Gold tends to rise with lower interest rates, while higher cost of money usually weighs down on the yellow metal. Still, most moves depend on how the US Dollar (USD) behaves as the asset is priced in dollars (XAU/USD). A strong Dollar tends to keep the price of Gold controlled, whereas a weaker Dollar is likely to push Gold prices up.
Author

Sagar Dua
FXStreet
Sagar Dua is associated with the financial markets from his college days. Along with pursuing post-graduation in Commerce in 2014, he started his markets training with chart analysis.
















