|

Gold Price Forecast: XAU/USD shoots to near $1960 as higher US jobless claims eases labor market conditions

  • Gold price has galloped to near $1,960.00 as US weekly jobless claims hit a 19-month high.
  • The market mood could turn cheerful as higher jobless claims would trim hawkish Fed bets.
  • Gold price has managed to defend a breakdown of the Ascending Triangle chart pattern.

Gold price (XAU/USD) has shown a sharp run after the release of higher-than-expected United States weekly jobless claims data. The precious metal has jumped to near $1,960.00 as the US Department of Labor reported a significant jump in the initial claims by 28K to 261K for the week ending June 02 while the street was anticipating a figure of 235K.

S&P500 futures are likely to open on a cautious note, however, the market mood could turn cheerful as higher jobless claims would trim hawkish Federal Reserve (Fed) bets. The US Dollar Index (DXY) has printed a fresh four-day low at 103.60 higher unemployment claims would ease out severe heat in the United States labor market.

19-month high US jobless claims are expected to fetch dovish commentaries from investment banking firms and Fed policymakers. Upbeat labor market conditions were the major catalyst, which was forcing Fed policymakers for supporting more interest rate hikes. The impact of higher jobless claims can also be seen in the US Treasury yields. The yields offered on 10-year US government bonds have sharply dropped below 3.78%.

In the longer-term, easing labor market conditions would also slim resilience in consumer spending and would further ease inflationary pressures.

Gold technical analysis

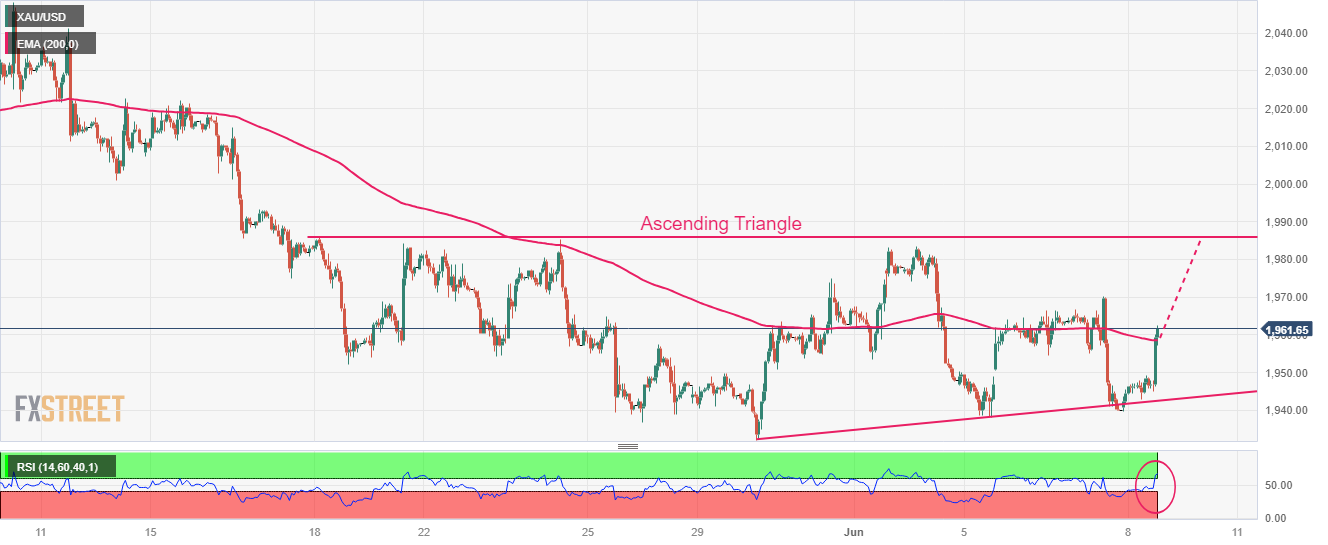
Gold price has managed to defend a breakdown of the Ascending Triangle chart pattern formed on an hourly scale. The precious metal has rebounded sharply and is approaching the horizontal resistance of the aforementioned pattern is placed from May 19 high at $1,983.29. While the upward-sloping trendline of the chart pattern is plotted from May 30 low at $1,932.12.

Gold price has climbed above the 200-period Exponential Moving Average (EMA) at $1,958.37, which indicates that the long-term trend has turned bullish.

Meanwhile, the Relative Strength Index (RSI) (14) has climbed above 60.00, which indicates that the upside momentum has been triggered.

Gold hourly chart

XAU/USD

Overview
Today last price1959.57
Today Daily Change19.62
Today Daily Change %1.01
Today daily open1939.95
 
Trends
Daily SMA201969.9
Daily SMA501990.55
Daily SMA1001940.31
Daily SMA2001839.01
 
Levels
Previous Daily High1970.23
Previous Daily Low1939.9
Previous Weekly High1983.5
Previous Weekly Low1932.12
Previous Monthly High2079.76
Previous Monthly Low1932.12
Daily Fibonacci 38.2%1951.49
Daily Fibonacci 61.8%1958.64
Daily Pivot Point S11929.82
Daily Pivot Point S21919.7
Daily Pivot Point S31899.49
Daily Pivot Point R11960.15
Daily Pivot Point R21980.36
Daily Pivot Point R31990.48

Author

Sagar Dua

Sagar Dua

FXStreet

Sagar Dua is associated with the financial markets from his college days. Along with pursuing post-graduation in Commerce in 2014, he started his markets training with chart analysis.

More from Sagar Dua
Share:

Markets move fast. We move first.

Orange Juice Newsletter brings you expert driven insights - not headlines. Every day on your inbox.

By subscribing you agree to our Terms and conditions.

Editor's Picks

EUR/USD bounces toward 1.1750 as US Dollar loses strength

EUR/USD returned to the 1.1750 price zone in the American session on Friday, despite falling Wall Street, which indicates risk aversion. Trading conditions remain thin following the New Year holiday and ahead of the weekend, with the focus shifting to US employment and European data scheduled for next week.

GBP/USD nears 1.3500, holds within familiar levels

After testing 1.3400 on the last day of 2025, GBP/USD managed to stage a rebound. Nevertheless, the pair finds it difficult to gather momentum and trades with modest intraday gains at around 1.3490 as market participants remain in holiday mood.

Gold trims intraday gains, approaches $4,300

Gold retreated sharply from the $4,400  area and trades flat for the day in the $4,320 price zone. Choppy trading conditions exacerbated the intraday decline, although XAU/USD bearish case is out of the picture, considering growing expectations for a dovish Fed and persistent geopolitical tensions.

Cardano gains early New Year momentum, bulls target falling wedge breakout

Cardano kicks off the New Year on a positive note and is extending gains, trading above $0.36 at the time of writing on Friday. Improving on-chain and derivatives data point to growing bullish interest, while the technical outlook keeps an upside breakout in focus.

Economic outlook 2026-2027 in advanced countries: Solidity test

After a year marked by global economic resilience and ending on a note of optimism, 2026 looks promising and could be a year of solid economic performance. In our baseline scenario, we expect most of the supportive factors at work in 2025 to continue to play a role in 2026.

Crypto market outlook for 2026

Year 2025 was volatile, as crypto often is.  Among positive catalysts were favourable regulatory changes in the U.S., rise of Digital Asset Treasuries (DAT), adoption of AI and tokenization of Real-World-Assets (RWA).