|

Gold Price Forecast: XAU/USD sets for action after sideways motion around $1,820 ahead of US PMI

  • Gold price is oscillating in a narrow range below $1,820.00 as investors await US Manufacturing PMI.
  • S&P500 futures have added more gains to Monday’s recovery, indicating an improvement in investors’ risk appetite.
  • The resilience observed in US consumer spending has forced the street to ramp up its terminal rate projections.

Gold price (XAU/USD) is demonstrating a sideways auction below $1,820.00 in the Asian session. The precious metal is expected to come out of the woods as investors are shifting their focus towards the United States ISM Manufacturing PMI (Feb), which is scheduled for Wednesday.

Investors should note that US Manufacturing PMI is contracting consecutively for the past three months. As per the consensus, the economic data is expected to contract again, however, the scale of contraction will be lower. The US Manufacturing PMI is seen at 48.0, lower than the former release of 47.4.

S&P500 futures have added more gains to Monday’s recovery in the Asian session, portraying an improvement in the risk appetite of the market participants. The US Dollar Index (DXY) is expected to demonstrate a volatility contraction till the release of the US ISM Manufacturing PMI data. The 10-year US Treasury yields are juggling around 3.92%.

Meanwhile, resilience observed in consumer spending (Feb) in the United States has forced the street to ramp up their terminal rate projections. A note from Bank of America (BofA) suggests Fed chair Jerome Powell announcing three more rate hikes this year considering the resilience in the demand-driven inflation. The BofA sees the terminal rate above 6% and recession appears more likely than a soft landing.

Gold technical analysis

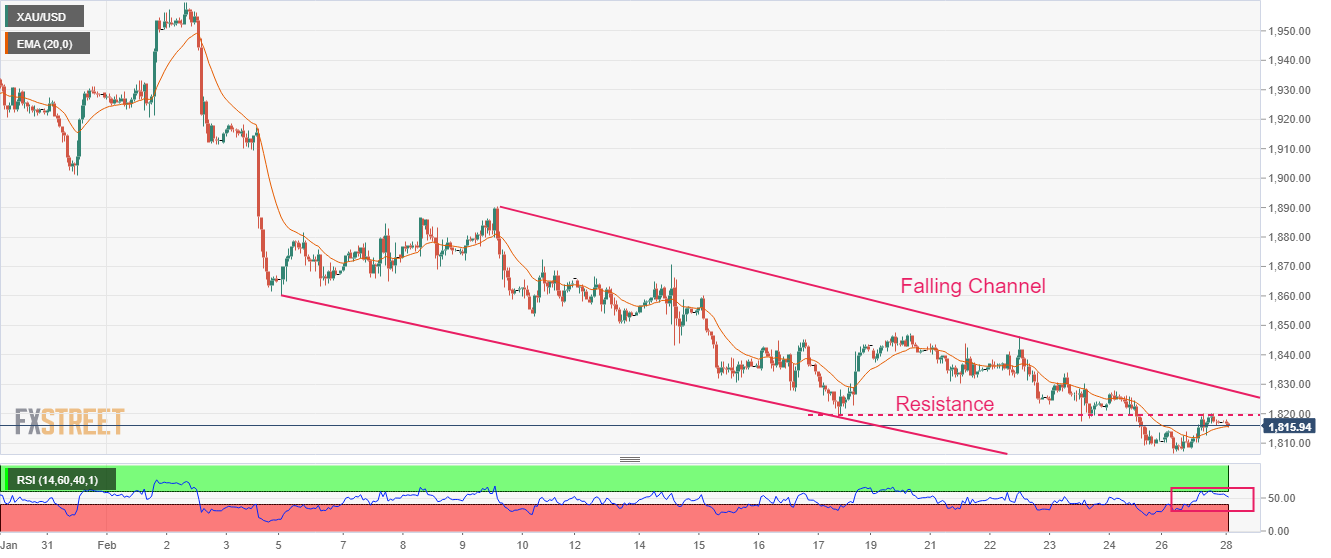
Gold price is auctioning in a Falling Channel chart pattern in which every pullback is considered as a selling opportunity before a reversal move. The precious metal has sensed resistance around $1,820.00 after a minor pullback move.

The 20-period Exponential Moving Average (EMA) at $1,815.83 is providing a cushion to the Gold bulls.

The Relative Strength Index (RSI) (14) is attempting to shift into the bullish range of 60.00-80.00.

Gold hourly chart
XAU/USD

Overview
Today last price1816.54
Today Daily Change-0.78
Today Daily Change %-0.04
Today daily open1817.32
 
Trends
Daily SMA201858.92
Daily SMA501865.96
Daily SMA1001793.84
Daily SMA2001775.83
 
Levels
Previous Daily High1820.21
Previous Daily Low1806.66
Previous Weekly High1847.59
Previous Weekly Low1808.99
Previous Monthly High1949.27
Previous Monthly Low1823.76
Daily Fibonacci 38.2%1815.03
Daily Fibonacci 61.8%1811.84
Daily Pivot Point S11809.25
Daily Pivot Point S21801.18
Daily Pivot Point S31795.7
Daily Pivot Point R11822.8
Daily Pivot Point R21828.28
Daily Pivot Point R31836.35

Author

Sagar Dua

Sagar Dua

FXStreet

Sagar Dua is associated with the financial markets from his college days. Along with pursuing post-graduation in Commerce in 2014, he started his markets training with chart analysis.


More from Sagar Dua
Share:

Editor's Picks

GBP/USD approaches May highs near 1.3650 on renewed USD selling

GBP/USD approaches the May high, while trading near 1.3650 in the European session on Thursday. The US Dollar slips again even as markets assess whether the US Treasury buyback will be a game-changer. Attention now remains on US data and Middle East headlines for further trading impetus.

EUR/USD hits fresh three-month highs above 1.1700

EUR/USD is at its highest level in three months, above 1.1700, in European trading on Thursday. The pair regains traction as the US Dollar resumes its downside, led by the US Treasury's bond buyback plan.. US Jobless Claims data are next in focus amid lingering Iran risks.

Gold stays in red below $4,500 despite resurgent USD supply

Gold sticks to modest intraday losses and remains below the $4,500 mark in the European session on Thursday. Despite geopolitical uncertainties, the US Dollar loses ground again, resuming the previous day’s slump to a three-month low.

Bitcoin extends gains above $71,000 as liquidity conditions improve

Bitcoin extends its gains, inching toward $72,000 on Thursday, as crypto markets continue to cheer the US Treasury’s decision to double its debt buyback operations. The move has sharply improved market sentiment and liquidity conditions, helped trigger a short squeeze, and overall provided a positive catalyst for the broader crypto market.

The bond coup
Yesterday was marked by a coup from the US Treasury, which suddenly announced that it will ‘at least double’ the maximum size of its buyback operations for longer-term debt, hoping to ease pressure on long-term yields and borrowing costs. Phoah! The markets reacted heavily to the news. The US 10-year yield fell sharply, while the 30-year yield dropped from its highest levels since 2007.
$20 billion offered, $2 billion taken: Why Treasury doubled its buyback cap

The US Treasury moved off its own calendar on Wednesday, and that is the part worth sitting with. At 12:32 GMT, the department said it would at least double the size of liquidity support buyback operations in the 10-year to 20-year and 20-year to 30-year sectors, lifting the maximum from $2 billion per operation to at least $4 billion, effective September 9 and running to November 4.