Gold Price Forecast: XAU/USD struggles to gain traction, flat-lined above $1,760 level
- Gold remains range-bound following the previous session’s upside movement.
- Higher US Treasury yields exert pressure on the higher side.
- US Debt ceiling, US-China optimism, Job data remain focus points.

Update: Gold shot to fresh daily tops, around the $1,767 region during the early European session, albeit lacked any follow-through buying. The XAU/USD quickly reversed an intraday dip to the $1,756 area and is now looking to build on the previous day's modest bounce from weekly lows. The US Treasury bond yields retreated further from the highest level since June – touched on Wednesday – and kept the US dollar bulls on the defensive. This, in turn, extended some support to the dollar-denominated commodity, though a combination of factors kept a lid on any further gains.
Investors seem convinced that the Fed would begin tapering its bond purchases by the end of 2021 and have also started pricing in the possibility of a rate hike in 2022. The prospects for an early policy tightening by the Fed should act as a headwind for the non-yielding yellow metal. Apart from this, the risk-on impulse – as depicted by a generally positive mood around the equity markets – should further collaborate to cap the upside for the perceived safe-haven gold. This makes it prudent to wait for a strong follow-through buying before positioning for any further gains.
Previous update: Gold prices continue to trade in a broader range of $1,770 and $1,750. The prices recovered from the lower levels as bullish bargain buyers stepped in to buy earlier dip in prices. On the other side, a higher US dollar index, rising US Treasury bond yields limit the gains.
The US Dollar Index, which tracks the performance of the greenback against the basket of six major currencies, remains flat near its one-year high at 94.20, making the precious metal cheaper for other currencies holders. The yield on the benchmark 10-year US Treasuries eased off more than a year high overnight but remained above the 1.5% mark.
The US ADP non-farm employment change for September came at a higher-than-expected 568,000 as compared to the forecast of 425,000 jobs. The upbeat reading came as COVID-19 cases subsidies boosting activity such as dining out restaurants and travel. The readings came before the more important US employment data from the Labor Department on Friday. Meanwhile, investors remained optimistic to monitor a debate in the US Senate to increase the debt ceiling. Although the Republicans and Democrats are nearing a deal for a temporary increase to avert a federal debt default, the bipartisan debate continues.
US stock futures rose sharply on Thursday following US politicians' deal to avoid a federal debt default, along with the reports that Washington and Beijing have agreed to hold a virtual meeting before the end of the year.
Technical levels
Gold prices have been trading in a continuous downturn trend in the shorter time frame. After testing the high near $1,834.02 in September, the prices held onto the downside momentum with recent refuge at the double bottom formation near $1,720. The prices trade below the 21-day Simple Moving Average (SMA) at $1,765, which is confirming the downside pressure on the gold.
XAU/USD daily chart
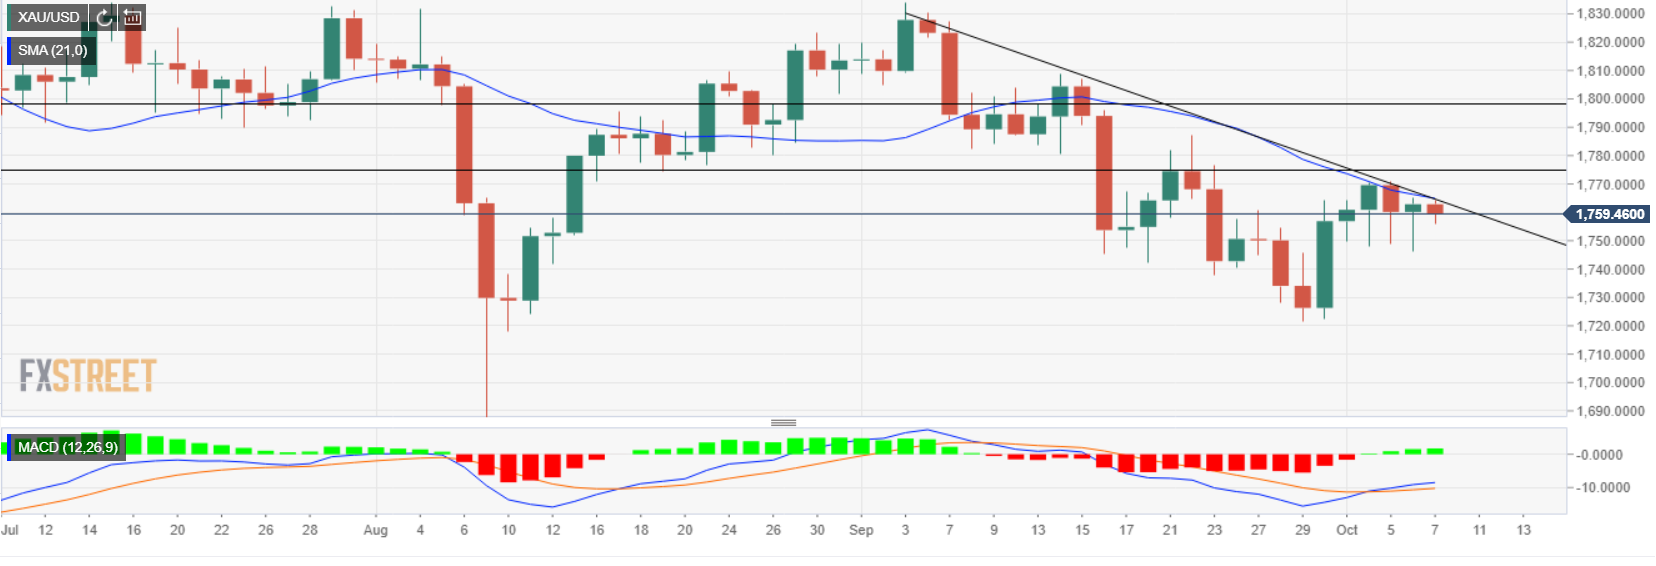
The Moving Average Convergence Divergence (MACD) holds onto the oversold zone. Any downtick in the MACD indicator would amplify the selling pressure and the prices would approach the previous day’s low at $1,746. A daily close below the $1,740 horizontal support level would entice the bears to test the low made on September 30 at $1,722. Next, XAU/USD could meet the key $1,700 level on the downside.
Alternatively, if the prices sustain an intraday high, it could retrace back to the $1,770 horizontal and the $1,785 horizontal resistance zones. Next, the market participant could test the high made on September 15 at $1806.
XAU/USD additional levels
Author

Rekha Chauhan
Independent Analyst
Rekha Chauhan has been working as a content writer and research analyst in the forex and equity market domain for over two years.


