|

Gold Price Forecast: XAU/USD refreshes day’s low near $1,740, Jackson Hole hogs limelight

  • Gold price has given a downside break of $1,745.02-1,749.15 territory and has refreshed day’s low at $1,744.00.
  • The odds of a 50 bps rate hike by the Fed are accelerating vigorously.
  • A decline in US Durable Goods Orders in times of soaring inflation will impact the DXY prices.

Gold price (XAU/USD) displayed an inventory distribution profile, oscillating in a narrow range of $1,745.02-1,749.15 but has given a downside break and has refreshed its day’s low at $1,744.00 in the Asian session. The precious metal has continued its five-day losing streak after surrendering Friday’s low of $1,745.59. The yellow metal is likely to remain on the tenterhooks as investors are awaiting Federal Reserve (Fed)’s commentary on policy guidance.

Considering the Fed minutes, the hawkish tone may trim as price pressures are reaching their peak levels and the consequences of shrinking liquidity from the US economy could display its true colors later. To maintain balance, a rate hike by 50 basis points (bps) looks optimal. Also, “Most economists in an Aug. 16-19 Reuters poll have predicted a half percentage point hike next month, the same as in the last poll, which would take the key interest rate to 2.75%-3.00%.”

This week, the cues from US Durable Goods Orders will also provide insights into the overall demand. As per the market consensus, the economic data is likely to decline to 0.6% from the prior release of 2%. In times, when the US economy has already displayed an unchanged US core Consumer Price Index (CPI), a decline in the economic data is not lucrative for the US dollar index (DXY).

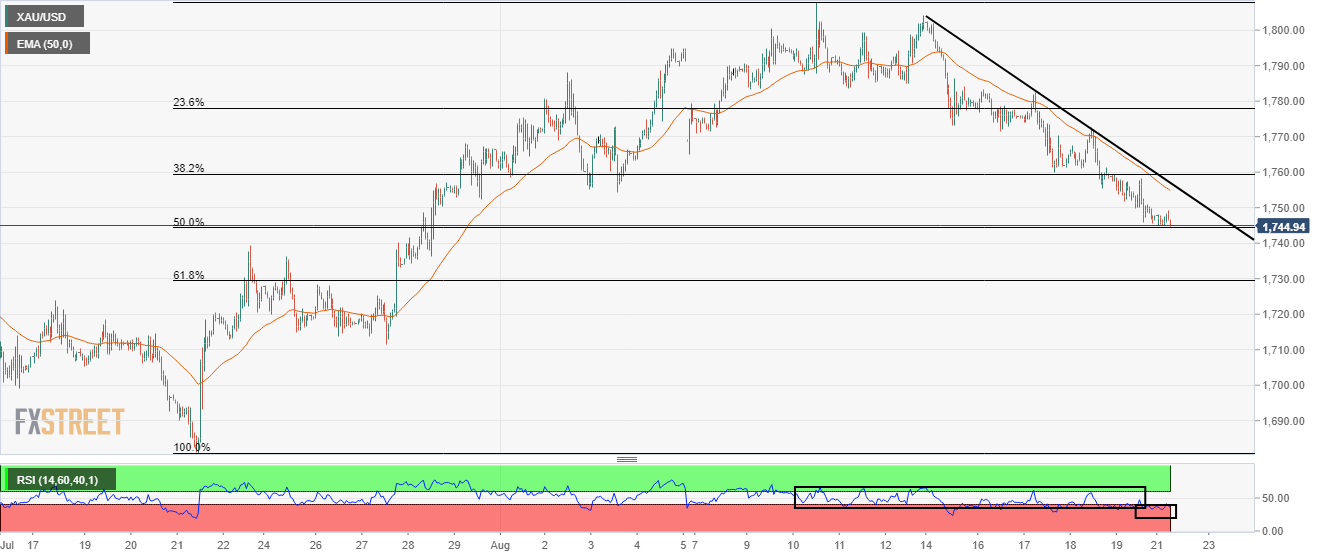
Gold technical analysis

Gold prices have declined to near 50% Fibonacci retracement (placed from July 21 low at $1,680.91 to August 10 high at $1,807.93) at $1,744.70 on an hourly scale. The downward sloping trendline placed from August 12 high at $1,804.00 will act as major resistance for the counter.

The 50-period Exponential Moving Average (EMA) at $1,755.00 is declining firmly, which adds to the downside filters. Meanwhile, the Relative Strength Index (RSI) (14) is oscillating in a bearish range of 20.00-40.00, which favors more downside ahead.  

Gold hourly chart

XAU/USD

Overview
Today last price1744.84
Today Daily Change-2.84
Today Daily Change %-0.16
Today daily open1747.68
 
Trends
Daily SMA201767.46
Daily SMA501774.28
Daily SMA1001829.23
Daily SMA2001840.27
 
Levels
Previous Daily High1759.48
Previous Daily Low1745.63
Previous Weekly High1802.51
Previous Weekly Low1745.63
Previous Monthly High1814.37
Previous Monthly Low1680.91
Daily Fibonacci 38.2%1750.92
Daily Fibonacci 61.8%1754.19
Daily Pivot Point S11742.38
Daily Pivot Point S21737.08
Daily Pivot Point S31728.53
Daily Pivot Point R11756.23
Daily Pivot Point R21764.78
Daily Pivot Point R31770.08

Author

Sagar Dua

Sagar Dua

FXStreet

Sagar Dua is associated with the financial markets from his college days. Along with pursuing post-graduation in Commerce in 2014, he started his markets training with chart analysis.

More from Sagar Dua
Share:

Editor's Picks

EUR/USD deflates to fresh lows, targets 1.1600

The selling pressure on EUR/USD now gathers extra pace, prompting the pair to hit fresh multi-week lows in the 1.1625-1.1620 band on Friday. The continuation of the downward bias comes in response to further gains in the US Dollar as market participants continue to assess the mixed release of US Nonfarm Payrolls in December.

GBP/USD breaks below 1.3400, challenges the 200-day SMA

GBP/USD remains under heavy fire and retreats for the fourth consecutive day on Friday. Indeed, Cable suffers the strong performance of the Greenback, intensified post-mixed NFP, and trades at shouting distance from its critical 200-day SMA near 1.3380.

Gold flirts with yearly tops around $4,500

Gold keeps its positive bias on Friday, adding to Thursday’s advance and challenging yearly highs in the $4,500 region per troy ounce. The risk-off sentiment favours the yellow metal despite the firmer tone in the Greenback and rising US Treasury yields.

Crypto Today: Bitcoin, Ethereum, XRP risk further decline as market fear persists amid slowing demand

Bitcoin holds $90,000 but stays below the 50-day EMA as institutional demand wanes. Ethereum steadies above $3,000 but remains structurally weak due to ETF outflows. XRP ETFs resume inflows, but the price struggles to gain ground above key support.

Week ahead – US CPI might challenge the geopolitics-boosted Dollar

Geopolitics may try to steal the limelight from US data. A possible US Supreme Court ruling on tariffs could dictate market movements. A crammed data calendar next week, US CPI comes on Tuesday; Fedspeak to intensify.

XRP trades under pressure amid weak retail demand

XRP presses down on the 50-day EMA support as risk-averse sentiment spreads despite a positive start to 2026. XRP faces declining retail demand, as reflected in futures Open Interest, which has fallen to $4.15 billion.