Gold Price Forecast: XAU/USD reaches YTD high around $2,048 amidst US economic slowdown
- Factory gate inflation in the US continued its downtrend, except for core.
- Unemployment claims for the last week jumped for the second consecutive week.
- Gold Price Analysis: Set to test the ATH around $2,075; otherwise, it could drop below $2,000.

Gold price advances though it remains off the highs of the year, reached earlier at around $2,048.79 after US data continued to show the economy is decelerating. Therefore, the US Dollar (USD) weakened as US Treasury bond yields continued their downward trajectory, while Gold rallied on safe-haven flows. The XAU/USD is trading at $2039.10 after reaching a low of $2,013.90.
US prices paid by producers plunge as inflation cools
The US Bureau of Labor Statistics (BLS) revealed that the March Producer Price Index (PPI) plunged 0.5% MoM, below estimates of 0%. The so-called core PPI, which excludes volatile items, dropped 0.1% MoM, beneath the 0.3% foresaw by the consensus. When compared year-over-year, the PPI was 2.7%, lower than the 3% of the street’s projections, while the core PPI was unchanged at 3.4%. That weighed on the American Dollar (USD), which is seen losing 0.61%, per the US Dollar Index, at 101.913.
Initial Jobless Claims in the US climbed for the second straight week
At the same time, Initial Jobless Claims for the week ending on April 8, reported by the Bureau, exceeded expectations, at 239K, vs. 232K estimates. That, alongside inflation in the United States (US) decelerating steadily, weighed on the US Dollar and bolstered the safe-haven Gold price, which remains at around the $2,040 area.
Will the latest US data trigger a Fed pivot?
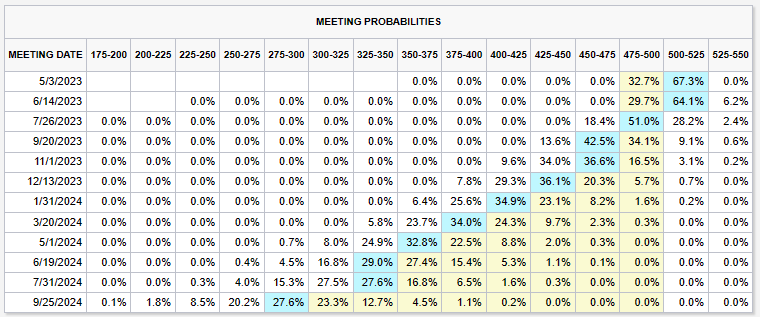
Given the above backdrop, the US Dollar remained offered across the FX board and against US Dollar denominated commodities. Expectations that the US Federal Reserve (Fed) is about to finish its tightening cycle inundated the financial markets, with the Federal Funds Rate (FFR) forecasted to peak at 5.00% - 5.25%. According to CME Fed WatchTool, chances for a 25 bps hike in May lie at 67.3%, but market participants have begun to price in rate cuts. Investors estimate the FFR would finish 2023 in the 4.25% - 4.50% range. That means 75 bps of rate cuts are expected following May’s hike.
Federal Reserve officials remained committed to taming inflation
Meanwhile, Federal Reserve policymakers led by San Francisco’s Fed Mary Daly said that “policy may have to tighten more to bring inflation down,” though acknowledged that there are good reasons that the economy “may continue to slow, even without additional policy adjustments.” Earlier, Richmond’s Fed President Thomas Barkin said that inflation has peaked but warned there are still ways to go.
XAU/USD Technical Analysis
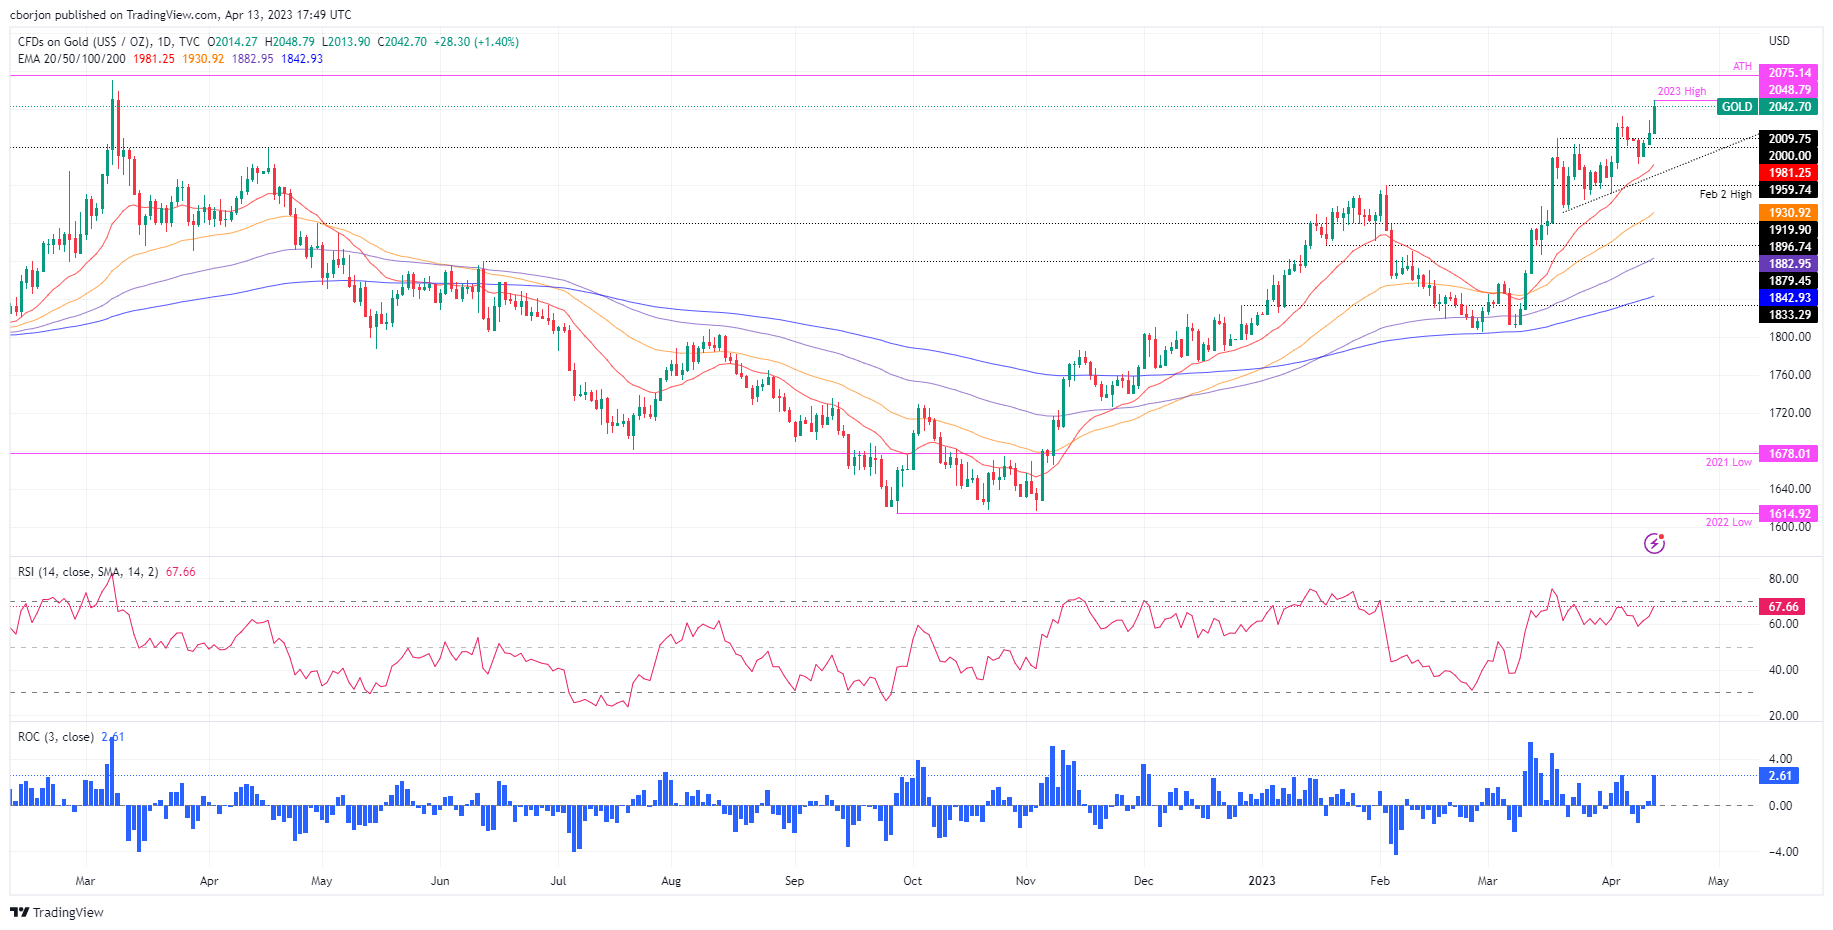
After cracking the previous YTD high at $2,032.13, the XAU/USD dipped before posing another challenge to reach a new YTD high. That happened six days after, with the Gold price hitting a new YTD high, shy of the $2,050 psychological level. For a bullish resumption, the XAU/USD needs to crack $2,050, so it can challenge the all-time high (ATH) at $2,075.14 before aiming toward $2,100. On the other hand, if XAU/USD drops back toward $2,000, that would pave the way for a break below the latter. Once that happens, the XAU/USD next support would be the April 10 swing low at $1,981.78, followed by the 20-day EMA at $1,981.25.
Author

Christian Borjon Valencia
FXStreet
Markets analyst, news editor, and trading instructor with over 14 years of experience across FX, commodities, US equity indices, and global macro markets.


