|

Gold Price Forecast: XAU/USD pokes weekly resistance near $1,800 on softer US Dollar

  • Gold price seesaws around intraday high after bouncing off one-week low the previous day.
  • US Dollar fades recovery moves from six-month low amid year-end sluggish markets, softer US data.
  • US Core PCE Price Index appears the key for XAU/USD traders amid hawkish Fed concerns.
  • Mixed headlines from China, light calendar elsewhere favor Gold buyers.

Gold price (XAU/USD) grinds higher towards $1,800, refreshing intraday top near $1,795 by the press time, as a softer US Dollar allows the Gold buyers to keep the reins during early Monday. In doing so, the bright metal extends the previous day’s recovery from a nearly eight-day low amid a sluggish last to the likely dull week.

That said, the US Dollar Index (DXY) prints the first daily loss in three, down 0.18% intraday near 104.58, amid cautious optimism in the market, which in turn teases XAU/USD bulls to return.

In doing so, the DXY struggles to justify the recently hawkish comments from Federal Reserve Bank of Cleveland President Loretta Mester and New York Federal Reserve President John Williams. The reason could be linked to Friday’s downbeat prints of the preliminary US PMIs for December, as well as the Fed’s 0.50% rate hike.

Elsewhere, recession fears keep the Gold bears on the table as global central banks defend their hawkish bias amid higher inflation fears. Additionally, mixed concerns surrounding China’s improvement in the Covid conditions also challenge the XAU/USD bulls.

Looking forward, Friday’s US Core Personal Consumption Expenditures (PCE) - Price Index, expected 4.6% YoY and 5.0% previous readings, will be important for the Gold traders as the same is the Fed’s preferred inflation gauge.

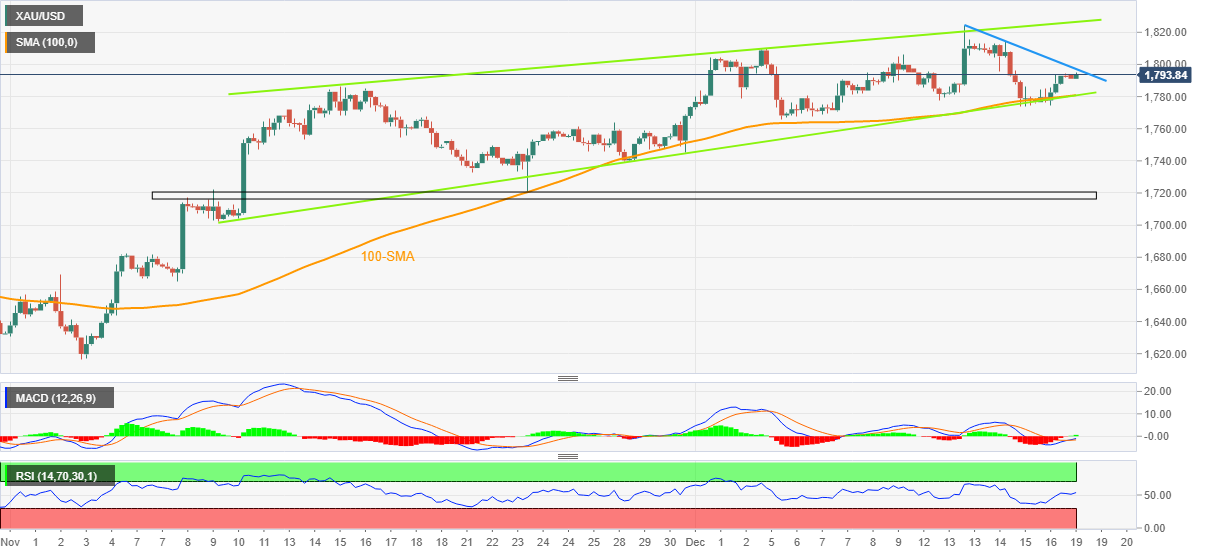
Gold price technical analysis

Gold struggles to defend the bounce off the $1,780 support confluence, comprising the 100-SMA and a five-week-old ascending trend line.

That said, bullish MACD signals and firmer RSI (14) keep Gold buyers hopeful of crossing the one-week-old descending resistance line, around $1800.

However, an upward-sloping trend line from November 15, close to $1,830 by the press time, will be a tough nut to crack for the Gold buyers.

Alternatively, a downside break of the $1,780 support confluence could quickly drag the Gold price toward the monthly low near $1,765.

Following that, a six-week-long horizontal support area surrounding $1,720 could challenge the Gold bears before highlighting the $1,700 threshold.

Gold price: Four-hour chart

Trend: Limited upside expected

Additional important levels

Overview
Today last price1794.72
Today Daily Change2.48
Today Daily Change %0.14%
Today daily open1792.24
 
Trends
Daily SMA201773.9
Daily SMA501719.35
Daily SMA1001720.72
Daily SMA2001787.06
 
Levels
Previous Daily High1794.31
Previous Daily Low1774.36
Previous Weekly High1824.55
Previous Weekly Low1773.83
Previous Monthly High1786.55
Previous Monthly Low1616.69
Daily Fibonacci 38.2%1786.69
Daily Fibonacci 61.8%1781.98
Daily Pivot Point S11779.63
Daily Pivot Point S21767.02
Daily Pivot Point S31759.68
Daily Pivot Point R11799.58
Daily Pivot Point R21806.92
Daily Pivot Point R31819.53

Author

Anil Panchal

Anil Panchal

FXStreet

Anil Panchal has nearly 15 years of experience in tracking financial markets. With a keen interest in macroeconomics, Anil aptly tracks global news/updates and stays well-informed about the global financial moves and their implications.

More from Anil Panchal
Share:

Markets move fast. We move first.

Orange Juice Newsletter brings you expert driven insights - not headlines. Every day on your inbox.

By subscribing you agree to our Terms and conditions.

Editor's Picks

EUR/USD bears await break below 100-day SMA support near 1.1665 area

The EUR/USD pair attracts heavy selling for the second straight day and dives to a nearly four-week trough, around the 1.1670 region, during the Asian session on Monday. Bearish traders now await a sustained break below the 100-day Simple Moving Average before positioning for an extension of the recent pullback from a three-month top, or levels just above the 1.1800 mark touched on December 24.

GBP/USD falls toward 1.3400 near 50-day EMA

GBP/USD extends its losses for the second successive session, trading around 1.3420 during the Asian hours on Monday. The technical analysis of the daily chart indicates that the 14-day Relative Strength Index at 53 has eased from near overbought, indicating that momentum has cooled while remaining above the midline. RSI holds above 50, keeping a modest bullish bias.

Gold on fire at the start of the week on US-Venezuela tensions

Gold regains upside traction early Monday as flight to safety prevails on Venezuela turmoil. The US Dollar finds strong haven demand, caps Gold’s upside as focus shifts to US jobs data. Gold’s daily technical setup suggests that more upside remains in the offing.

Bulls firmly in control as Bitcoin breaks $93K, Ethereum and Ripple extend gains

Bitcoin, Ethereum, and Ripple extended their rallies on Monday, gaining more than 4%, 6%, and 12%, respectively, in the previous week. The top three cryptocurrencies by market capitalization could continue to outperform, with bulls in control of the momentum.

Economic outlook 2026-2027 in advanced countries: Solidity test

After a year marked by global economic resilience and ending on a note of optimism, 2026 looks promising and could be a year of solid economic performance. In our baseline scenario, we expect most of the supportive factors at work in 2025 to continue to play a role in 2026.

Meme Coins Price Prediction: Dogecoin, Shiba Inu, Pepe rally on Venezuela’s shadow BTC reserve

Meme coins such as Dogecoin, Shiba Inu, and Pepe are leading the cryptocurrency market rally driven by the US cross-border operation to capture Venezuelan President Nicolás Maduro. Dogecoin extends its gain for the fifth consecutive day while SHIB and PEPE take a pause.